6.
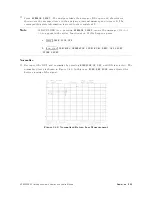
A
djust
the
tracking
generator's
output
power
with
the
OUTPUT
LEVEL
controls:
increase
the
output
power
6
dB
by
setting
the
attenuator
(right-hand)
knob
to
0
dBm
and
the
vernier
(left-hand)
knob
to
04
dBm.
This
output-power
level
diers
from
the
level
used
for
the
transmission
measurement
example
because
a
6
dB
coupler
is
used
in
the
reection
measurement
setup
.
7.
Select
stimulus-response
auto-coupled
sweep
time
mode
for
the
spectrum
analyzer
by
pressing
4
AUX
CTRL
5
NNNNNNNNNNNNNNNNNNNNNNNNNNNNNNNNNNNNNNNNNNNNNNNNNNNNN
TRACKING
GENRATOR
NNNNNNNNNNNNNNNNNNNNNNNNNNNNNNNNNNNNNNNNN
SWP
CPL
SA
SR
until
SR
is
selected.
8.
A
djust
the
spectrum
analyzer
settings
according
to
the
measurement
requirements
.
F
or
this
measurement,
set
the
analyzer
to
frequencies
around
the
minimum
reection
region
of
the
lter
.
Change
the
start
frequency
to
1
MHz
and
the
stop
frequency
to
1
GHz.
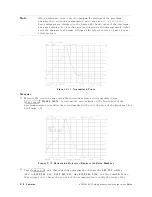
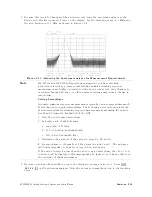
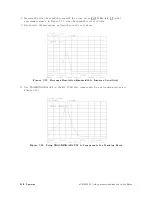
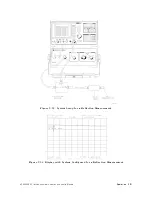
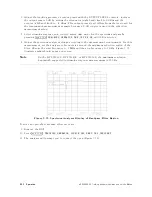
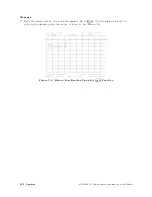
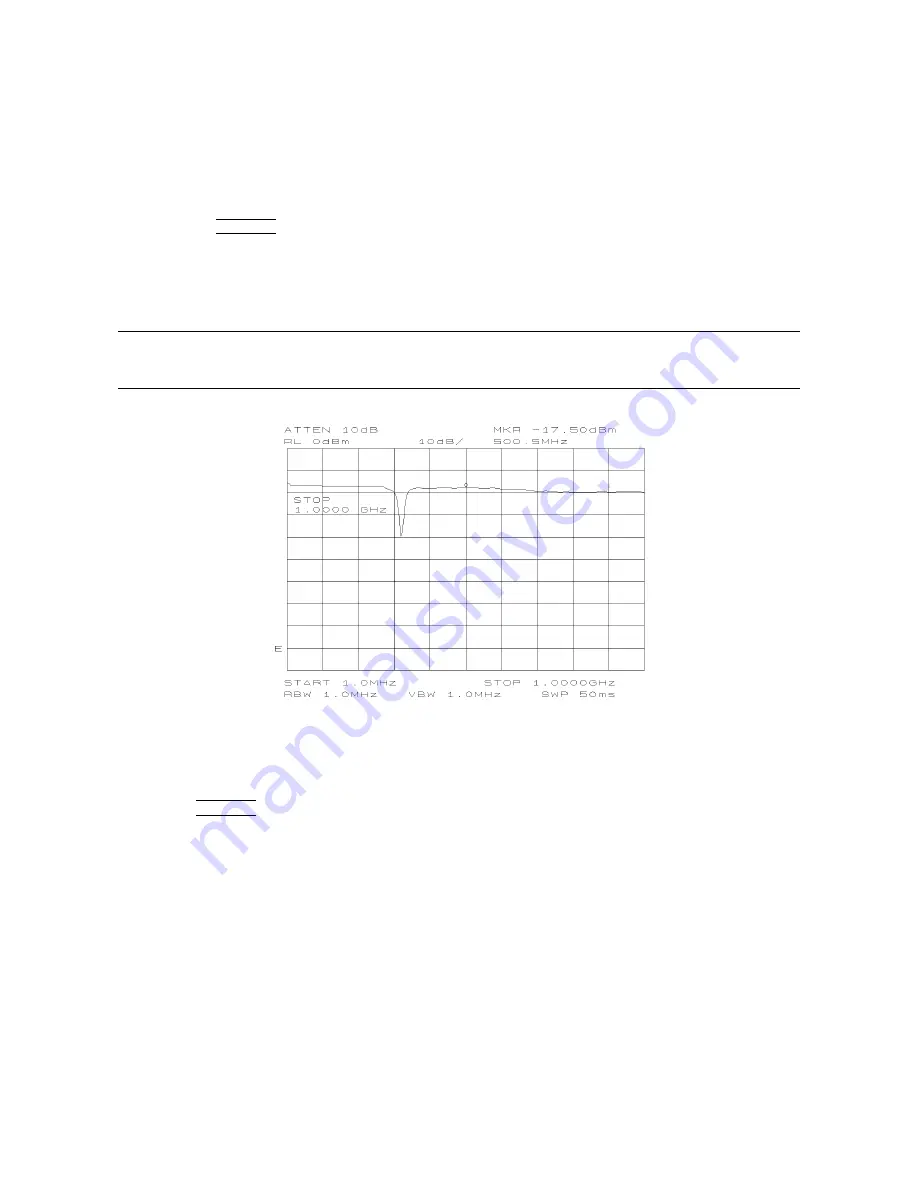
Figure
3-35
illustrates
what
should
appear
on-screen.
Note
On
the
HP
8560A/E,
HP
8561B/E,
or
HP
8563A/E,
the
minimum
resolution
bandwidth
supported
in
stimulus-response
measurements
is
300
Hz.
Figure
3-35.
Spectrum
Analyzer
Display
of
Bandpass
Filter
Region
T
o
store
an
open/short-average
reference
trace:
9.
Remove
the
DUT
.
10.
Press
4
AUX
CTRL
5
N
NNNNNNNNNNNNNNNNNNNNNNNNNNNNNNNNNNNNNNNNNNNNNNNNNNNN
TRACKING
GENRATOR
NNNNNNNNNNNNNNNNNNNNNNNNNNNNNNNNNNNNNNNNNNNNNNN
SOURCE
CAL
MENU
NNNNNNNNNNNNNNNNNNNNNNNNNNNNNNNNNNNNNN
CAL
OPN/SHRT
.
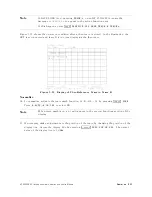
11.
The
analyzer
will
prompt
you
to
connect
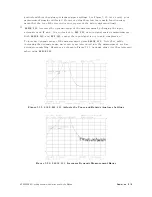
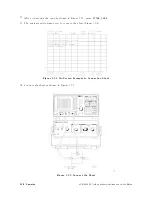
the
open
(Figure
3-36 ).
3-32
Operation
HP
85640A
RF
T
racking
Generator
Operation
and
Service
Manual
Summary of Contents for 85640A
Page 2: ...HP 85640A RF Tracking Generator Operation and Service Manual ABCDE Printed in USA ...
Page 111: ......
Page 169: ......

