DCFM Professional User Manual
7
53-1001773-01
User interface components
1
Toolbox
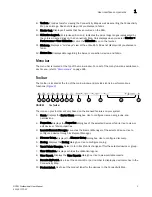
The toolbox (
Figure 5
) is located at the top right side of the View window and provides tools to
export the topology, to zoom in and out of the Connectivity Map, collapse and expand groups, and
fit the topology to the window. Does not display until you discover a fabric.
FIGURE 5
The Toolbox
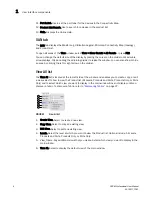
1. Export. Use to export the topology to a PNG file.
2. Zoom In. Use to zoom in on the Connectivity Map
3. Zoom Out. Use to zoom out on the Connectivity Map.
4. Fit in View. Use to scale the map to fit within the Connectivity Map area.
5. Expand. Use to expand the map to show all ports in use on a device.
6. Collapse. Use to collapse the map to show only devices (hides ports).
Master Log
The Master Log, which displays in the lower left area of the main window, lists the events and alerts
that have occurred on the SAN. If you do not see the Master Log, select View > Show Panels > All
Panels or press F5.
You can sort the Master Log by clicking a column heading. By default, the Master Log is sorted by
the Last Event Server Time column. To filter information in the Master Log, refer to
“Filtering events
in the Master Log”
on page 179.
The following fields and columns are included in the Master Log:
•
Level. The severity of the event. When the same event (Warning or Error) occurs repeatedly, the
Management application automatically eliminates the additional occurrences. For more
information about events, refer to
“Fault Management”
on page 173. For a list of the event
icons, refer to
“Event icons”
on page 13.
•
Source Name. The product on which the event occurred.
•
Source Address. The IP address (IPv4 or IPv6 format) of the product on which the event
occurred.
•
Type. The type of event that occurred (for example, client/server communication events).
•
Description. A description of the event.
•
First Event Server Time. The time and date the event first occurred on the server.
•
Last Event Server Time. The time and date the event last occurred on the server.
•
First Event Product Time. The time and date the event first occurred on the product.
•
Last Event Product Time. The time and date the event last occurred on the product.
•
Operational Status. The operational status (such as, unknown, healthy, marginal, or down) of
the product on which the event occurred.
5
6
1
2
3
4
Summary of Contents for Brocade BladeSystem 4/12
Page 1: ...53 1001773 01 14 April 2010 DCFM Professional User Manual Supporting DCFM 10 4 X ...
Page 3: ...DCFM Professional User Manual iii 53 1001773 01 ...
Page 4: ...iv DCFM Professional User Manual 53 1001773 01 ...
Page 88: ...56 DCFM Professional User Manual 53 1001773 01 Seed switch 2 ...
Page 146: ...114 DCFM Professional User Manual 53 1001773 01 Customizing the main window 4 ...
Page 152: ...120 DCFM Professional User Manual 53 1001773 01 Launching HCM Agent 5 ...
Page 246: ...214 DCFM Professional User Manual 53 1001773 01 Syslog forwarding 8 ...
Page 262: ...230 DCFM Professional User Manual 53 1001773 01 Generating zoning reports 10 ...
Page 662: ...630 DCFM Professional User Manual 53 1001773 01 ...

