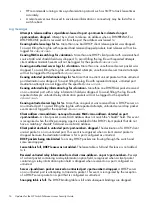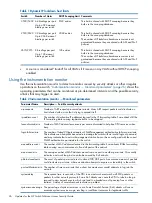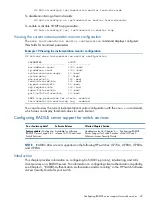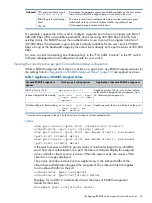
To generate alerts for monitored events, enable the instrumentation monitoring log or SNMP trap.
Adjust the threshold for each monitored parameter to minimize false alarms (see
instrumentation monitor” (page 27)
).
When a parameter exceeds its threshold, an alert (event log message or SNMP trap) is generated
to inform network administrators of this condition.
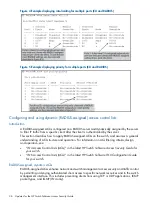
“Event log message generated by instrumentation
shows an event log message that occurs when the number of MAC addresses
learned in the forwarding table exceeds the configured threshold:
Figure 2 Event log message generated by instrumentation monitor
Alerts are automatically rate-limited to prevent filling the log file with redundant information.
limiting when multiple messages are generated” (page 27)
shows an example of alerts that occur
when the device is continually subject to the same attack (too many MAC addresses in this instance):
Example 18 Rate limiting when multiple messages are generated
W 01/01/90 00:05:00 inst-mon: Limit for MAC addr count (300) is exceeded (321)
W 01/01/90 00:10:00 inst-mon: Limit for MAC addr count (300) is exceeded (323)
W 01/01/90 00:15:00 inst-mon: Limit for MAC addr count (300) is exceeded (322)
W 01/01/90 00:20:00 inst-mon: Limit for MAC addr count (300) is exceeded (324)
W 01/01/90 00:20:00 inst-mon: Ceasing logs for MAC addr count for 15 minutes
In
“Rate limiting when multiple messages are generated” (page 27)
, if a condition is reported 4
times (persists for more than 15 minutes), then alerts cease for 15 minutes. If after 15 minutes the
condition still exists, the alerts cease for 30 minutes, then for 1 hour, 2 hours, 4 hours, 8 hours,
and after that the persisting condition is reported once a day. As with other event log entries, these
alerts can be sent to a syslog server.
Known Limitations:
The instrumentation monitor runs once every five minutes. The current
implementation does not track information such as the port, MAC, and IP address from which an
attack is received.
Configuring instrumentation monitor
The following commands and parameters are used to configure the operational thresholds that are
monitored on the switch. By default, the instrumentation monitor is disabled.
Syntax:
[
no
]
instrumentation monitor
[
parameterName | all
] [
<low | med | high
| limitValue>
]
Detail: default
Task
Parameter
Default threshold setting when
enabled: see parameter details
below
Enables/disables all counter types
on the switch but does not
enable/disable instrumentation
monitor logging.
[all]
Default threshold setting when
enabled: 1000 (med)
The number of arp requests
processed each minute.
[arp-requests]
Using the instrumentation monitor
27


