Statistics 2Var app
201
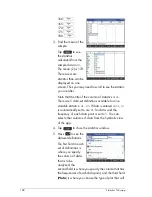
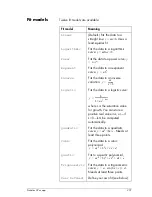
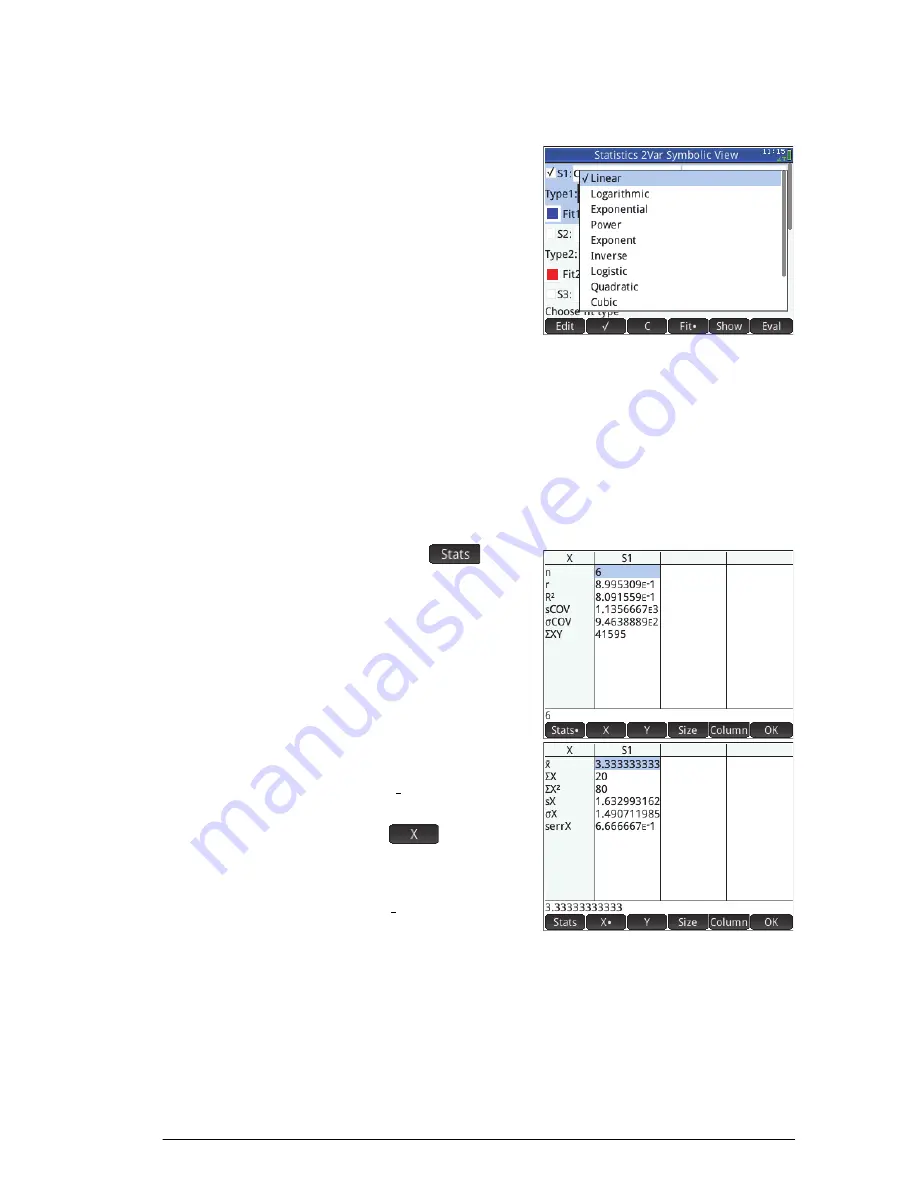
5. Select a fit:
From the
Type 1
field select a fit. In
this example,
select
Linear
.
6. If you want to
choose a color for
the graph of the
data in Plot view,
see “Choose a color for plots” on page 74.
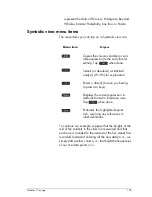
7. If you have more than one analysis defined in
Symbolic view, deselect any analysis you are not
currently interested in.
Explore statistics
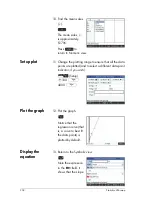
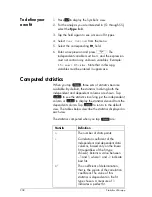
8. Find the correlation,
r
, between advertising time and
sales:
M
The correlation is
r=0.8995…
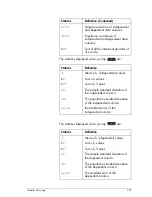
9. Find the mean
advertising time
( ).
The mean
advertising time,
, is 3.33333…
minutes.
x
x
Summary of Contents for NW280-200X
Page 1: ...HP Prime Graphing Calculator User Guide ...
Page 4: ......
Page 56: ...50 Reverse Polish Notation RPN ...
Page 64: ...58 Computer algebra system CAS ...
Page 107: ...An introduction to HP apps 101 ...
Page 108: ...102 An introduction to HP apps ...
Page 188: ...182 Spreadsheet these variables is provided in chapter 21 Variables beginning on page 373 ...
Page 220: ...214 Statistics 2Var app ...
Page 252: ...246 Linear Solver app ...
Page 258: ...252 Parametric app ...
Page 268: ...262 Sequence app ...
Page 404: ...398 Units and constants ...
Page 416: ...410 Lists ...
Page 442: ...436 Notes and Info ...
Page 532: ...526 Limiting functionality ...
Page 536: ...530 ...
Page 540: ...534 ...


