Statistics 2Var app
203
(
m
) of the regression line is 425.875 and the
y
-
intercept (
b
) is 376.25.
Predict values
Let’s now predict the sales figure if advertising were to go
up to
6 minutes.
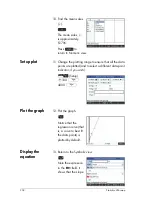
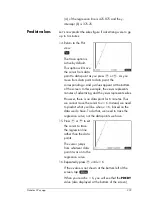
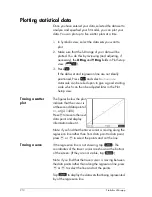
14. Return to the Plot
view:
P
The trace option is
active by default.
This option will move
the cursor from data
point to data point as you press
>
or
<
. As you
move from data point to data point, the
corresponding
x
- and
y
-values appear at the bottom
of the screen. In this example, the
x
-axis represents
minutes of advertising and the
y
-axis represents sales.
However, there is no data point for 6 minutes. Thus
we cannot move the cursor to
x
= 6. Instead, we need
to
predict
what
y
will be when
x
= 6, based on the
data we do have. To do that, we need to trace the
regression curve, not the data points we have.
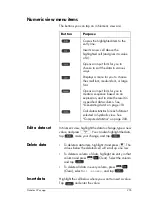
15. Press
\
or
=
to set
the cursor to trace
the regression line
rather than the data
points.
The cursor jumps
from whatever data
point it was on to the
regression curve.
16. Repeatedly press
>
until
x
= 6.
If the
x
-value is not shown at the bottom left of the
screen, tap
.
When you reach x = 6, you will see that the
PREDY
value (also displayed at the bottom of the screen)
Summary of Contents for NW280-200X
Page 1: ...HP Prime Graphing Calculator User Guide ...
Page 4: ......
Page 56: ...50 Reverse Polish Notation RPN ...
Page 64: ...58 Computer algebra system CAS ...
Page 107: ...An introduction to HP apps 101 ...
Page 108: ...102 An introduction to HP apps ...
Page 188: ...182 Spreadsheet these variables is provided in chapter 21 Variables beginning on page 373 ...
Page 220: ...214 Statistics 2Var app ...
Page 252: ...246 Linear Solver app ...
Page 258: ...252 Parametric app ...
Page 268: ...262 Sequence app ...
Page 404: ...398 Units and constants ...
Page 416: ...410 Lists ...
Page 442: ...436 Notes and Info ...
Page 532: ...526 Limiting functionality ...
Page 536: ...530 ...
Page 540: ...534 ...

