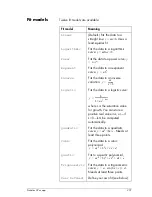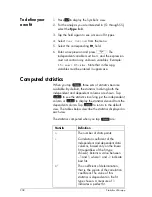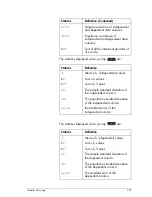
Statistics 2Var app
211
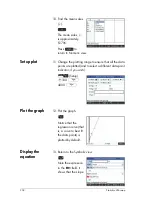
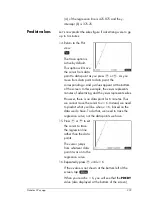
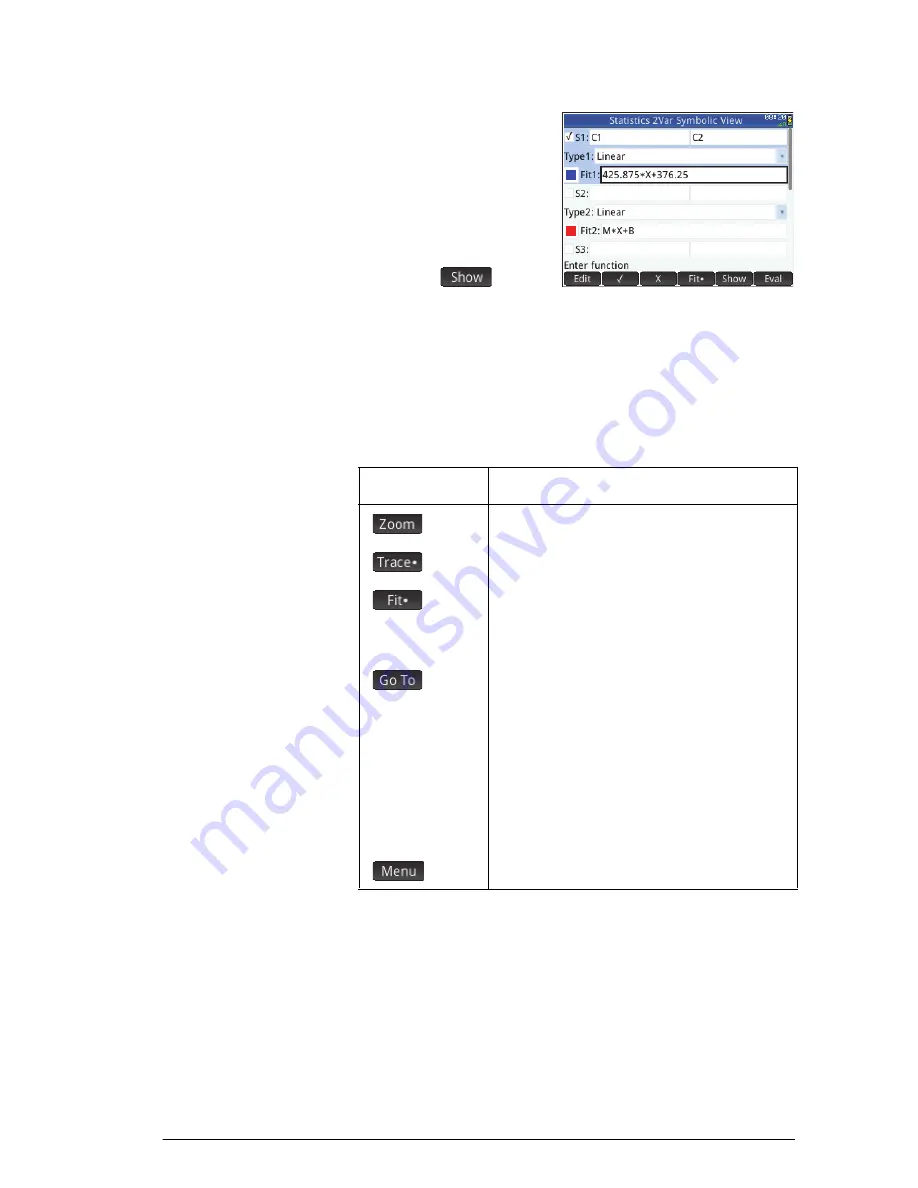
Press
Y
to see the
equation of the
regression line in
Symbolic view.
If the equation is too wide
for the screen, select it
and press
.
The example above shows that the slope of the regression
line (m) is 425.875 and the
y
-intercept (b) is 376.25.
Plot view: menu items
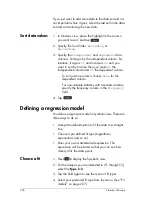
The menu items in Plot view are:
Plot setup
As with all the apps that provide a plotting feature, he Plot
Setup view—
SP
(Setup)—enables you to set the
range and appearance of Plot view. The common settings
available are discussed in “Common operations in Plot
Setup view” on page 86. The Plot Setup view in the
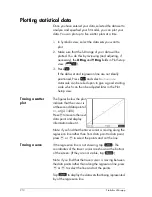
Statistics 2Var app has two additional settings:
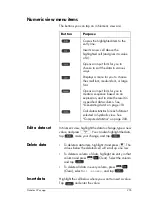
Button
Purpose
Displays the Zoom menu.
Turns trace mode on or off.
Shows or hides a curve that best fits
the data points according to the
selected regression model.
Enables you to specify a value on the
regression line to jump to (or a data
point to jump to if your cursor is on a
data point rather than on the
regression line). You might need to
press
=
or
\
to move the cursor to
the object of interest: the regression
line or the data points.
Shows or hides the menu buttons.
Summary of Contents for NW280-200X
Page 1: ...HP Prime Graphing Calculator User Guide ...
Page 4: ......
Page 56: ...50 Reverse Polish Notation RPN ...
Page 64: ...58 Computer algebra system CAS ...
Page 107: ...An introduction to HP apps 101 ...
Page 108: ...102 An introduction to HP apps ...
Page 188: ...182 Spreadsheet these variables is provided in chapter 21 Variables beginning on page 373 ...
Page 220: ...214 Statistics 2Var app ...
Page 252: ...246 Linear Solver app ...
Page 258: ...252 Parametric app ...
Page 268: ...262 Sequence app ...
Page 404: ...398 Units and constants ...
Page 416: ...410 Lists ...
Page 442: ...436 Notes and Info ...
Page 532: ...526 Limiting functionality ...
Page 536: ...530 ...
Page 540: ...534 ...


