Advanced Web Tools user guide
25
Fabric OS 3.x Document Addendum
3. Select the Switch Events button from the Switch View.
A Switch Events Report appears.
4. Click Filter.
The Event Filter dialog box opens.
5. Click Level.
The event severity level check boxes are enabled.
6. Select the event levels you want to display.
7. Click OK.
The filter is enabled and the enabled filter type is displayed in the Events Report.
On original page 92, under the heading “Switch Admin Window Field Descriptions,”
modify original Table 17, “Switch Admin Window Field Descriptions,” as follows.
Delete the following row:
In the last row (Status Icon) in the table, replace the following text:
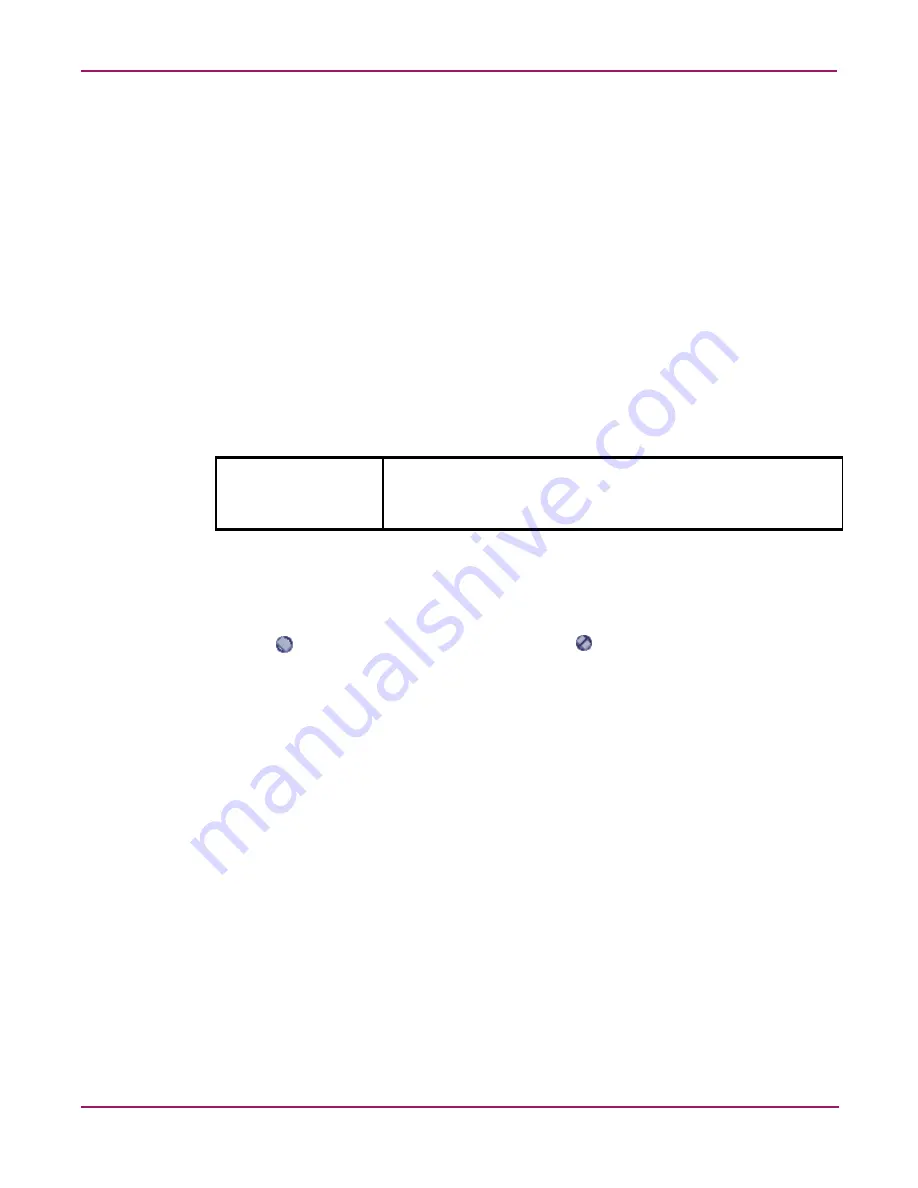
A green square means the switch is enabled; a red square means the switch is disabled.
With this text:
The
icon means the switch is enabled, and the
icon means the switch is disabled.
Reset
Click this button to reset the field values to the last set of committed
changes. If the Apply button has not been pressed on this tab, the
parameters are returned to the original values the tab contained
when it was initially displayed.
Summary of Contents for StorageWorks 2/16 - SAN Switch
Page 8: ...Contents 8 Fabric OS 3 x Document Addendum ...
Page 16: ...Advanced performance monitor user guide 16 Fabric OS 3 x Document Addendum ...
Page 72: ...Advanced Web Tools user guide 72 Fabric OS 3 x Document Addendum ...
Page 130: ...Extended fabric user guide 130 Fabric OS 3 x Document Addendum ...
Page 150: ...Fabric OS procedures user guide 150 Fabric OS 3 x Document Addendum ...
Page 238: ...Fabric OS reference guide 238 Fabric OS 3 x Document Addendum ...


