251
Process monitoring and maintenance
commands
The
display memory
,
display
process
,
display
process cpu
,
monitor process
and
monitor
thread
commands display information about both user processes and kernel threads. In these
commands, "process" refers to both user processes and kernel threads.
display exception context
Use
display exception context
to display context information for process exceptions.
Syntax
In standalone mode:
display
exception context
[
count
value
] [
slot
slot-number
[
cpu
cpu-number
] ]
In IRF mode:
display
exception context
[
count
value
] [
chassis
chassis-number
slot
slot-number
[
cpu
cpu-number
] ]
Views
Any view
Predefined user roles
network-admin
mdc-admin
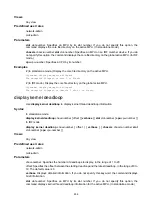
Parameters
count
value
: Specifies the number of context information entries, in the range of 1 to 20. The default
value is 1.
slot
slot-number
: Specifies an MPU by its slot number. If you do not specify this option, the
command displays context information for process exceptions on the active MPU. (In standalone
mode.)
chassis
chassis-number
slot
slot-number
: Specifies an MPU on an IRF member device. If you do
not specify this option, the command displays context information for process exceptions on the
global active MPU. (In IRF mode.)
cpu
cpu-number
: Specifies a CPU by its number.
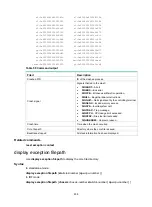
Usage guidelines
The system generates a context information entry for each process exception. A context information
entry includes the process ID, the crash time, the core file directory, stack information, and register
information.
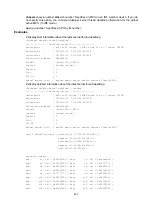
Examples
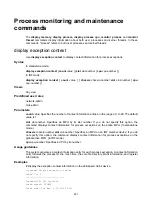
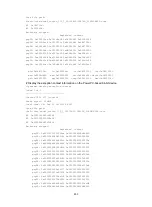
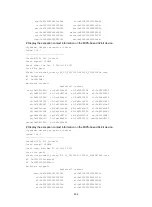
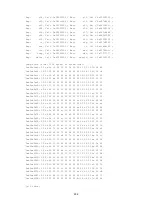
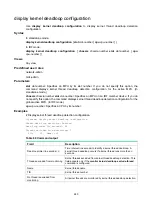
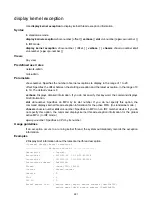
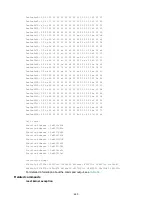
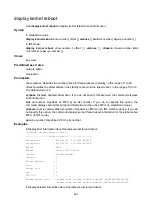
# Display the exception context information on the x86-based 32-bit device.
<Sysname> display exception context
Index 1 of 1
------------------------------
Crashed PID: 120 (routed)
Crash signal: SIGBUS
Crash time: Tue Apr 9 17:14:30 2013

