background image


HT7052 


EN - 12

6.1.1  Time dependence test – Diagnostic test 

Diagnostic test is a long duration test for evaluating the quality of the insulation material 
under test. The results of this test enable the decision to be made on the preventive 
replacement of the insulation material 
 

DIELECTRIC ABSORPTION RATIO (DAR)


DAR is ratio of Insulation Resistance values measured after 15s and after 1 minute. The 
DC test voltage is present during the whole period of the test (also an Insulation 
Resistance measurement is continually running). At the end, the DAR ratio is displayed: 
 

 

s

DAR

R

R

iso

iso

15

min

1


Some applicable values: 
 

DAR value 

Tested material status 

< 1.25 

Not acceptable 

< 1.6 

Considered as good insulation 

> 1.6 

Excellent 

 
When determining Riso (15s) pay attention to the capacitance of the test object. It has to 
be charged-up in the first time section (15s). Approximate maximum capacitance using: 
 

 

 

 

V

s

F

U

t

C

10

3

max

.


where: 
t = period of first time unit (e.g. 15s) 
U = test voltage. 
 
To avoid this problem, increase the 

DIAG. Starting time

 parameter in CONFIGURATION 

menu, because start of timer in the DIAGNOSTIC TEST functions depends on the test 
voltage. The timer begins to run when test voltage reaches the threshold voltage, which is 
product of the 

DIAG. Starting time

 and nominal test voltage

  (Unominal)


Using filters (fil1, fil2, fil3) in the DAR function is not recommended! 
 
Analysing the change in the measured insulation resistance over time and calculating the 
DAR and PI are very useful maintenance tests of an insulating material 


Summary of Contents for HT7052

Page 1: ... Copyright HT ITALIA 2013 Release EN 2 00 02 01 2013 ENGLISH User manual ...

Page 2: ......

Page 3: ...rminal 16 6 3 Use of internal filters 17 6 3 1 The purpose of filtering 17 6 4 Voltage measurement 18 6 5 Insulation resistance measurement 19 6 5 1 Setting of parameters 19 6 5 2 Perform the measurement 20 6 6 Diagnostic test 22 6 6 1 Setting of parameters 22 6 6 2 Perform the measurement 23 6 7 Insulation resistance with step voltage test 25 6 7 1 Setting of parameters 25 6 7 2 Perform the measu...

Page 4: ...electric shocks In this manual and on the instrument the following symbols are used WARNING Observe the instructions reported in the manual An improper use could damage the instrument and lead to dangerous situations for the operator DC voltage or current Dangerous voltages risk of electric shocks Instrument with double insulation 1 1 PRELIMINARY INSTRUCTIONS This instrument has been designed for ...

Page 5: ...nt control and laboratory use Part 1 General requirements defines what is intended for measurement category commonly known as overvoltage category In 6 7 4 Measuring circuits it reads Circuits are divided into the following measurement categories Measurement category IV is for measurements performed at the source of a low voltage installation Examples are electric counters and measurements on prim...

Page 6: ...rtionately set within preset test voltage range Programmable timer 1 min up to 30 min per step Polarization Index PI Dielectric Absorption ratio DAR and Dielectric Discharge DD ratio measurements PI Rins t2 Rins t1 DAR R1min R15s DD Idis1min C U Withstanding voltage DC up to 10 kV Programmable ramp test voltage from 500 V up to 10 kV High resolution ramp approx 25 V per step Programmable threshold...

Page 7: ... mains by means of a battery charger integrated in the instrument itself The symbol illuminated in the left bottom part indicates that the batteries are flat and must be recharged To recharge or replace the batteries follow the instructions given in 10 2 CAUTION Use only NiMh rechargeable batteries IEC LR20 Connect the instrument to the mains power supply for 20 hours to fully charge batteries typ...

Page 8: ... key to store recall and erase results 10 Light key to turn the display backlight ON or OFF 11 Positive insulation resistance test terminal OUTPUT 12 13 GUARD test terminals intended to lead away potential leakage current 14 Negative insulation resistance test terminal OUTPUT 15 Screw to fixing battery cover 16 Battery cover 17 USB galvanic port for connection to PC 18 RS 232 galvanic port for con...

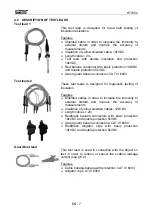
Page 9: ...ads 2 These test leads is designed for diagnostic testing of insulation Features Shielded cables in order to increase the immunity to external disturb and improve the accuracy of measurements Insulation of yellow shielded cables 12kVDC Length cables 2m Red black banana connectors with basic protection 10kVDC and double protection 5kVDC Green guard banana connectors CAT IV 600V Red Black alligator ...

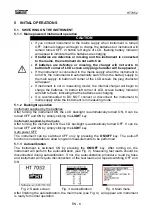
Page 10: ...h indicating that the batteries are charging It is recommended to DO NOT connect or disconnect the instrument to mains supply while the instrument is in measuring mode 5 1 2 Backlight operation Instrument supplied by the batteries After turning the instrument ON the LCD backlight is automatically turned ON It can be turned OFF and ON by simply clicking the LIGHT key Instrument supplied by the main...

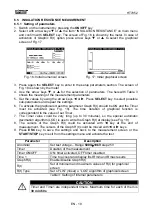
Page 11: ...urement procedure see Fig 5 and Fig 6 In the lower section of the display the power supply status is shown Fig 5 Configuration menu Fig 6 Setup menu PARAMETERS VALUE DESCRIPTION Memory clear Clear all memory locations Filter Fil1 Fil2 Fil3 Fil0 Selection of noise rejecting filter see 6 3 DIAG Starting time 0 90 Adjustment of start of the timer in the DIAGNOSTIC TEST functions according to the nomi...

Page 12: ... the voltage is defined by the appropriate product application group This voltage is lower than the voltage used in the withstanding voltage test so the tests can be applied more frequently without stressing the test material Typical insulation tests In general insulation resistance tests consist of the following possible procedures Simple insulation resistance measurement also called a spot test ...

Page 13: ...ed for the Insulation capacitance Ciso to be charged up Sometimes it is required to take ambient temperature into account and adjust the result for a standard temperature of 40 C If surface leakage currents interfere with the measurements see Riss above use the guard connection see 5 2 This becomes critical when measured values are in the G range Voltage dependence test Step voltage test This test...

Page 14: ...acceptable 1 6 Considered as good insulation 1 6 Excellent When determining Riso 15s pay attention to the capacitance of the test object It has to be charged up in the first time section 15s Approximate maximum capacitance using V s F U t C 10 3 max where t period of first time unit e g 15s U test voltage To avoid this problem increase the DIAG Starting time parameter in CONFIGURATION menu because...

Page 15: ...ation older types 4 very high insulation resistance Modern type of good insulation systems When determining Riso 1min pay close attention to the capacitance of the object under test It has to be charged up in the first time section 1 min Approximate maximum capacitance using V s F U t C 10 3 max where t period of first time unit e g 1min U test voltage To avoid this problem increase the DIAG Start...

Page 16: ...erial In practice this is not the case DD is the diagnostic insulation test carried out after the completion of the Insulation Resistance measurement Typically the insulation material is left connected to the test voltage for 10 30 min and then discharged before the DD test is carried out After 1 minute a discharge current is measured to detect the charge re absorption of the insulation material A...

Page 17: ...ined test time see Fig 10 left part or it happens the breakdown on device under test see Fig 10 right part Fig 10 Withstanding test without breakdown left and with breakdown right Ut test voltage t time Ustart starting voltage Ustep voltage step approx 25 V fixed value not modify Ustop end test voltage Tstep test voltage duration per step Tend constant test voltage duration after reaching End valu...

Page 18: ...ive to the Guard terminal where Ut Test voltage IL Leakage current resulted by surface dirt and moisture IM Material current resulted by material conditions IA Test current Result without GUARD terminal RINS Ut IA Ut IM IL Incorrect result Result using GUARD terminal RINS Ut IA Ut IM correct result The GUARD terminal it is internal connected at the same negative test lead black The alligator clip ...
Page 19: ...rents at the mains frequency and its harmonics switching transients etc cause the results to become unstable These currents are mostly cross talk through insulation capacitances close to live systems Other currents induced or coupled in the electromagnetic environment of the insulation under test Ripple current from internal high voltage regulator Charging effects of high capacitive loads and or l...

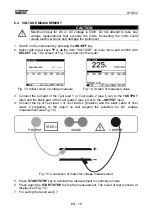
Page 20: ...f voltage measure Fig 14 Screen of measured value 3 Connect the red part of the Test lead 1 or Test leads 2 see 4 2 to the OUTPUT input and the black part of the Test leads 2 see 4 2 to the OUTPUT input 4 Connect the tip of Test lead 1 or Test leads 2 positive and the black cable of Test leads 2 negative to the object on test respect the polarities for DC voltage measurement see Fig 15 Fig 15 Conn...

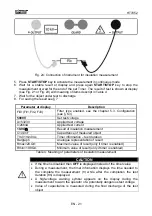
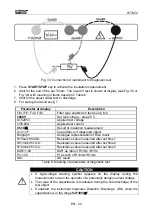
Page 21: ...the Timer must be activated see Fig 18 The time duration of graphical function is correspondent to the value of set Timer 7 The Timer value could be very long up to 30 minutes so the special automatic decimation algorithm LOG is use to write the Graph R t at display see Fig 19 8 The cursors of the Graph R t could be activated with key at the end of measurement The cursors of the Graph R t could be...

Page 22: ...row keys or to select the graphical screen of Fig 22 CAUTION It is not possible to switching mode of presentation when measurement running Fig 20 Initial numerical screen Fig 21 Numerical screen of result Fig 22 Initial graphical screen Fig 23 Graphical screen of result 3 Connect the red part of the Test lead 1 or Test leads 2 see 4 2 to the OUTPUT input and the black part of the Test leads 2 see ...

Page 23: ...A Applied test current 19 9G Result of insulation measurement C 0 0nF Capacitance of measured object Tm 01min 04s Timer information test duration Bargraph Analogue representation of result Rmax 20 G Maximum value of result only if timer is enabled Rmin 19 9G Minimum value of result only if timer is enabled Table 4 Meaning of parameters of insulation measurement CAUTION If the timer is disabled the...

Page 24: ...raphical function is correspondent to the value of set Time3 7 The Timer value could be very long up to 30 minutes so the special automatic decimation algorithm LOG is use to write the Graph R t at display see Fig 28 8 The cursors of the Graph R t could be activated with key at the end of measurement The cursors of the Graph R t could be moved with or keys 9 Press ESC key to save the settings and ...

Page 25: ...AUTION It is not possible to switching mode of presentation when measurement running Fig 29 Initial numerical screen Fig 30 Numerical screen of result Fig 31 Initial graphical screen Fig 32 Graphical screen of result 3 Connect the red part of the Test lead 1 or Test leads 2 see 4 2 to the OUTPUT input and the black part of the Test leads 2 see 4 2 to the OUTPUT input In case of use of GUARD termin...

Page 26: ...lation measurement C 2 1nF Capacitance of measured object Bargraph Analogue representation of Riso result R15sec 95 0G Resistance value measured after set time 1 R01min 95 1G Resistance value measured after set time 2 R10min 95 1G Resistance value measured after set time 3 DAR 1 00 DAR as ratio of R1min R15s PI 1 00 PI as ratio of R10min R1min DD DD result Table 6 Meaning of parameters of diagnost...

Page 27: ...raphical screen the parameter Graph R t should be ON and the Timer must be activated see Fig 36 The time duration of graphical function is correspondent to the value of Step Timer multiplied by 5 7 The Timer value could be very long up to 150 minutes so the special automatic decimation algorithm LOG is use to write the Graph R t at display see Fig 37 8 The cursors of the Graph R t could be activat...

Page 28: ...not possible to switching mode of presentation when measurement running Fig 38 Initial numerical screen Fig 39 Numerical screen of result Fig 40 Initial graphical screen Fig 41 Graphical screen of result 3 Connect the red part of the Test lead 1 or Test leads 2 see 4 2 to the OUTPUT input and the black part of the Test leads 2 see 4 2 to the OUTPUT input 4 Connect the tip of Test lead 1 or Test le...

Page 29: ...s Actual test duration R1000V 40 0G Last result of 1st step R2000V 40 0G Last result of 2nd step R3000V 40 0G Last result of 3rd step R4000V 39 8G Last result of 4th step R5000V 39 7G Last result of 5th step U1 1076V 1st step voltage U2 2141V 2nd step voltage U3 3238V 3rd step voltage U4 4278V 4th step voltage U5 5302V 5th step voltage Table 8 Meaning of parameters of insulation measurement with s...

Page 30: ...ress SELECT key to select possible sub parameters and repeat the settings 6 Press ESC key to save the settings and back to the measurement screen or the START STOP key to exit from the settings menu and activate the test Parameter Description Ustart Start test voltage Range 500V 10kV step 25V Ustop Stop test voltage Range 500V 10kV step 25V Itrigg Set trigger leakage current Range 0 001mA 5mA step...

Page 31: ...e set timers run out or until breakdown occurs The result of test is shown at display see Fig 44 with meaning of items descript in Table 10 7 Wait for the object under test to discharge 8 For saving the result see 7 Parameter at display Description 2000V Start test voltage 7000V Stop test voltage 7221V Applied test voltage I 0 002mA Measured leakage current Tm 01min 00s Timer information Table 10 ...

Page 32: ...st saved data is shown at display 2 Use the arrow keys or to select and display the saved data correspondent to the previous memory locations 3 The recalled data with G indication means the presence of a graphical screen more than the numerical Press SELECT key to display the graphical screen and ESC to return to the numerical one 4 Press ESC key to exit from the function and return in measurement...

Page 33: ...ems Win2k XP Vista Win7 32 bit and 64 bit platforms 8 1 INSTALLATION OF SOFTWARE AND INITIAL CONFIGURATIONS WIN XP 1 Close all the open application on the PC 2 Insert the supplied CD ROM in the PC reader 3 Launch the TeraView exe file included on CD ROM and follow the steps to correctly install the TeraView software 4 Switch on the instrument set the USB mode see 5 2 and connect it to the PC by us...

Page 34: ...installed The TeraView program can detect automatically serial ports from the COM1 to the COM16 Follow the herewith steps to modify the COM associated to USB driver Right click of mouse on the My computer icon on the PC desktop and selection of Properties item Hardware folder Device Manager Ports COM LPT Move on the USB CDC Serial Port Emulation COMxx item right click Properties Select Port Settin...

Page 35: ...normally takes about 3 charge and discharge cycles for the batteries to regain full capacity The operator does not need to disconnect the instrument from mains supply after the full recharging period The instrument can be connected permanently The instrument will only work when rechargeable batteries are inside the instrument In case of batteries replacement follow the herewith steps CAUTION Nomin...

Page 36: ...or 1mA Short circuit test current 5mA 10 Automatic discharge of tested object yes Measurement range test voltage Resolution Accuracy 0 9999V 1V 3 0 rdg 3V 10kV 0 1kV 3 0 rdg Nominal test voltage 500 10kV DC programmable in step of 25V Accuracy of test voltage 0 10 20V Output power 10W max Measurement range test current Resolution Accuracy 0 00 9 99nA 0 01nA 5 0 rdg 0 05nA 10 0 99 9nA 0 1nA 100 999...

Page 37: ... 50mA 0 01mA 3 0 rdg Nominal test voltage 500 10kV DC programmable in steps of 25V Accuracy of test voltage 0 10 20V AC or DC VOLTAGE Measurement range Resolution Accuracy 0 600V 1V 3 0 rdg 4V Input impedance 3M 10 Voltage frequency Resolution Accuracy 0 e 45 0 65 0Hz 0 1Hz 0 2Hz Frequency within 0 and 45Hz displayed 45Hz Frequency 65Hz displayed 65Hz CAPACITANCE Measurement range Resolution Accur...

Page 38: ...d 1 N USB interface type B standard 115000 baud 10 3 ENVIRONMENT Reference temperature 10 C 30 C 50 F 86 F Reference humidity 40 RH 60 RH Operating temperature 10 C 50 C 14 F 122 F Operating humidity 90 HR Storage temperature 20 C 70 C 4 F 158 F Storage humidity 90 HR This instrument complies with the requirements of European Directive on low voltage 2006 95 EC LVD and of Directive EMC 2004 108 EC...

Page 39: ...sequence of improper packaging Repairs which may become necessary as a consequence of interventions performed by unauthorized personnel Modifications to the instrument performed without the manufacturer s explicit authorization Use not provided for in the instrument s specifications or in the instruction manual The content of this manual cannot be reproduced in any form without the manufacturer s ...

Reviews: