NO TE
● The temperature curve (upper) and the humidity curve (lower) are displayed on the
same screen. The abscissa shows time. The temperature set point is the midpoint
temperature on the upper ordinate while the humidity set point is the midpoint
humidity on the lower ordinate.
● The temperature and humidity curves show the current average temperature and
humidity of the control type.
● You can tap
and
to zoom in or out the range of the temperature and
humidity ordinate. The midpoint temperature is the temperature set point and the
midpoint humidity is the humidity set point after the ordinate range is zoomed in or
out.
● You can view the temperatures from (temp set point – 3°C) to (temp set point + 3°C) at
least and from (temp set point – 30°C) to (temp set point + 30°C) at most.
● You can view the humidity from (humidity set point – 5%) to (humidity set point + 5%)
at least, and from (humidity set point – 50%) to (humidity set point + 50%) at most.
Specific humidity fluctuation range displayed varies according to different models of
smart cooling products.
----End
7.1.2 Querying Logs
Context
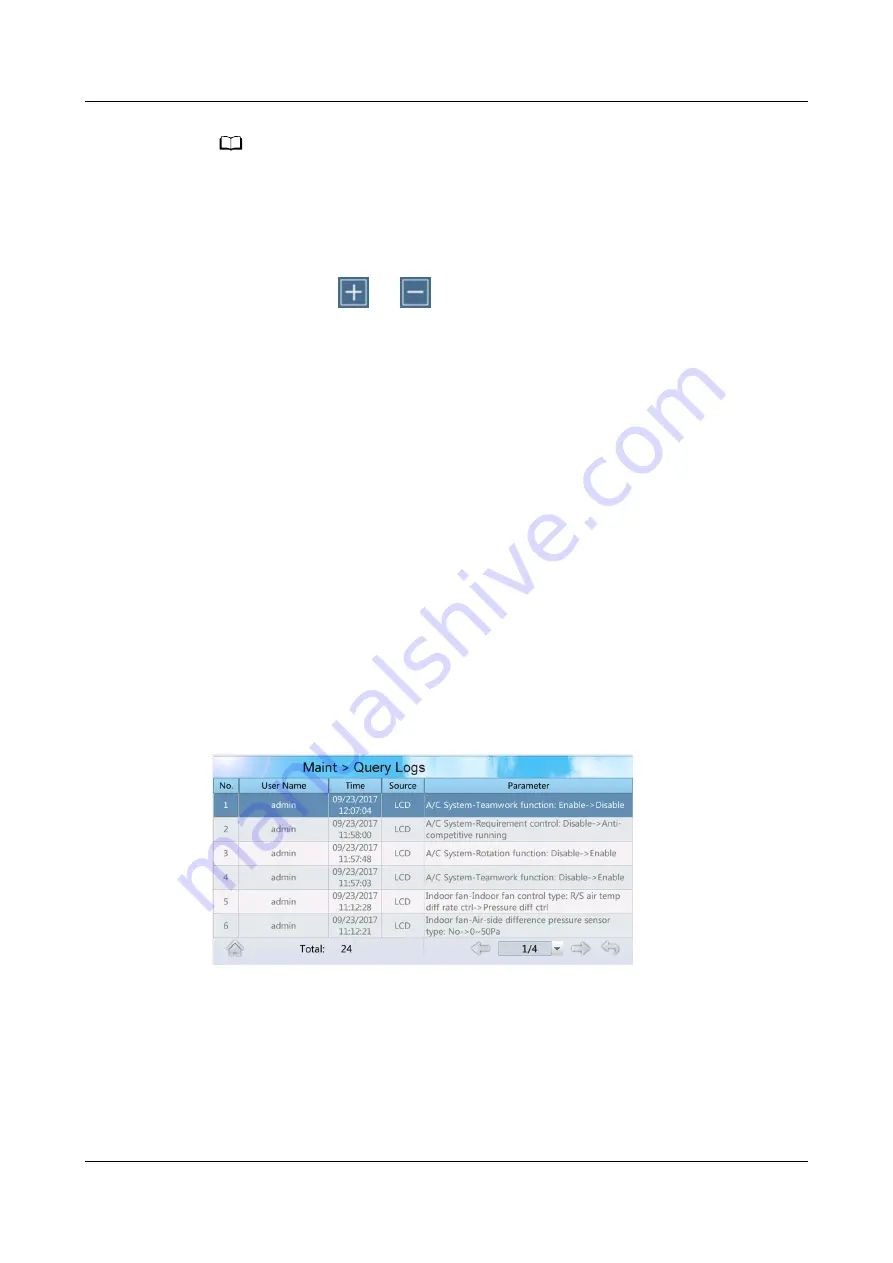
The Query Logs screen displays the operations performed by the user.
Procedure
Step 1 On the home screen, choose Maint > Query Logs.
is displayed.
Figure 7-2 Query logs screen
----End
7.1.3 Querying Component Status
Context
You can query component status in the following two ways.
NetCol5000-C(030, 032, 065) In-row Chilled Water
Smart Cooling Product
User Manual (2019)
7 FAQ
Issue 03 (2020-08-30)
Copyright © Huawei Technologies Co., Ltd.
168


