UPS2000-G-(6 kVA-20 kVA)
User Manual
4 Control Panel
Issue 10 (2017-01-19)
Huawei Proprietary and Confidential
Copyright © Huawei Technologies Co., Ltd.
52
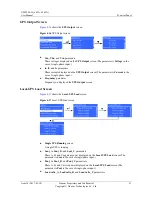
Phase A, B, and C load ratio displayed on the
Local-UPS Load
screen (the parameter is
Load ratio
in the case of single-phase input.)
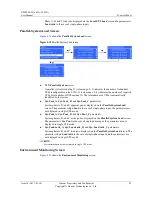
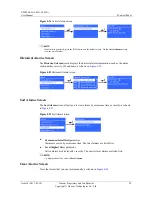
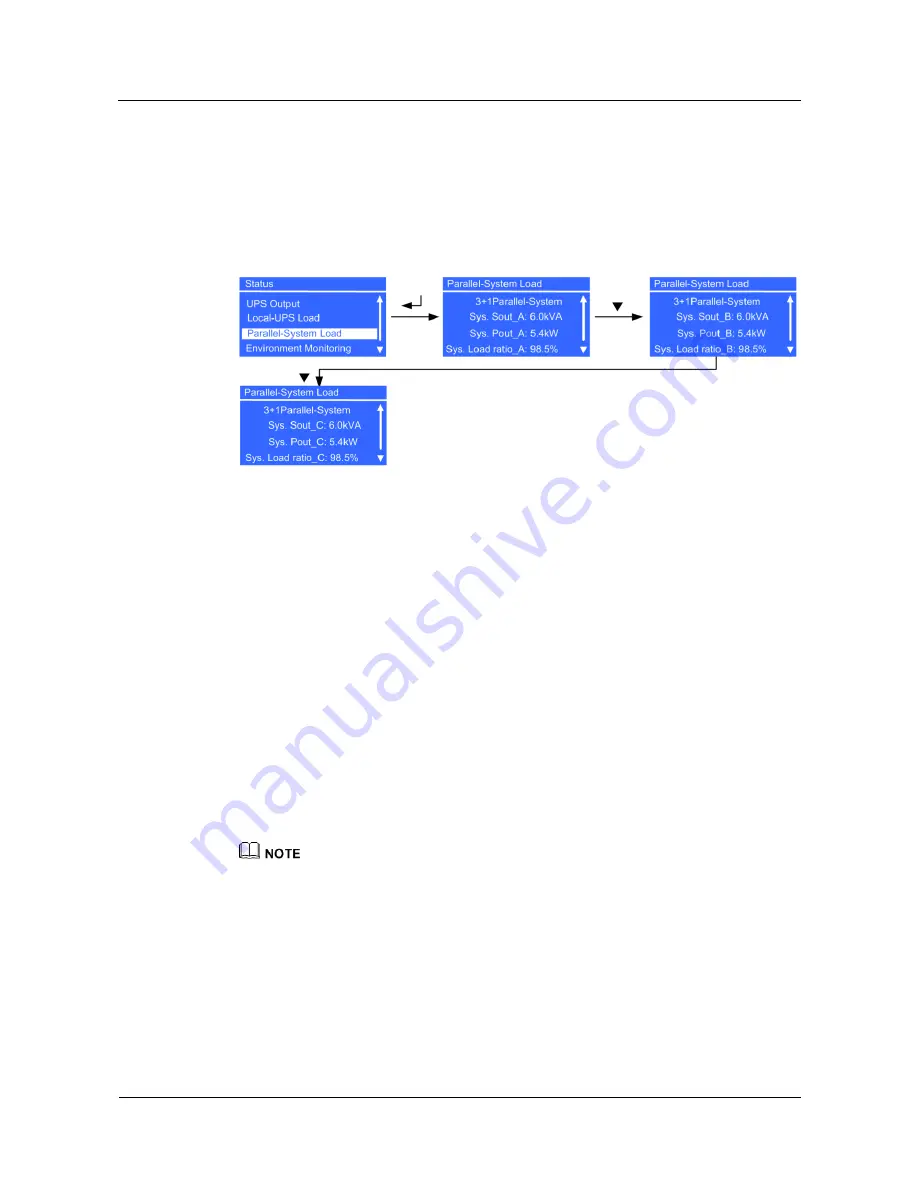
Parallel-System Load Screen
Figure 4-18
shows the
Parallel-System Load
screen.
Figure 4-18
Parallel-System Load screen
N+X Parallel-System
screen
A parallel system is running. X (value range: 0–3) indicates the number of redundant
UPSs (configurable on the LCD); N (value range: 1–4) indicates the number of requisite
UPSs (total number of UPSs minus X). The total number of UPSs is automatically
identified by the system.
Sys. Sout_A, Sys. Sout_ B
, and
Sys. Sout_C
parameters
System phase A, B, and C apparent power displayed on the
Parallel-System Load
screen. The parameter is
Sys. Sout
in the case of single-phase input; the parameters are
not displayed in single UPS mode.
Sys. Pout_A, Sys. Pout_ B
, and
Sys. Pout_C
parameters
System phase A, B, and C active power displayed on the
Parallel-System Load
screen.
The parameter is
Sys. Pout
in the case of single-phase input; the parameters are not
displayed in single UPS mode.
Sys. Load ratio_A, Sys. Load ratio_B
, and
Sys. Load ratio_C
parameters
System phase A, B, and C load ratio displayed on the
Parallel-System Load
screen. The
parameter is
Sys. Load ratio
in the case of single-phase input, and the parameters are
not displayed in single UPS mode.
System information is not displayed in single UPS mode.
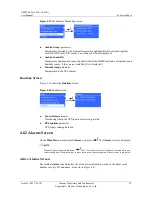
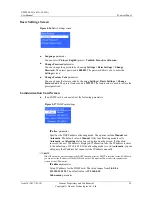
Environment Monitoring Screen
Figure 4-19
shows the
Environment Monitoring
screen.


