16
2.5.2 Button function for result page
(1)Error Data
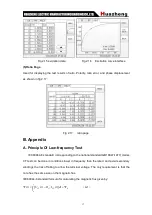
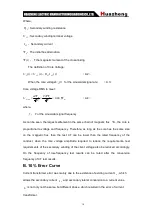
Selecting the error data will show 5% and 10% error cases, the relationship of rated
primary current multiple and the maximum burden is shown as Fig 2.13. These data is
calculated according to the actual excitation. The calculation Method is given in appendix
B.
Fig 2.13 5% error data interface
Fig 2.14 5% error curve interface
(2)Error Curve
Selecting the error curve, the relationship curve of rated primary current multiple and
maximum burden will be shown as fig 2.14 according to 10% (or 5%) error. The x axis is
rated primary current multiple; axis y is allowable maximum burden.
(3)Excitation Data
Selecting the excitation data, excitation data interface will be shown fig 2.15. In the
figure, knee voltage and current is automatically calculated and shown, the user can print
the date.
(4)Excitation Curve
Selecting Excitation curve, the excitation curve of the interface will be shown in Fig
2.16, knee voltage and current is given.


