User manual R3
DLCP
- 22 -
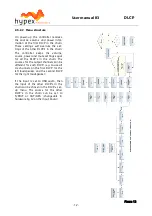
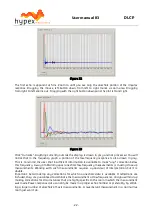
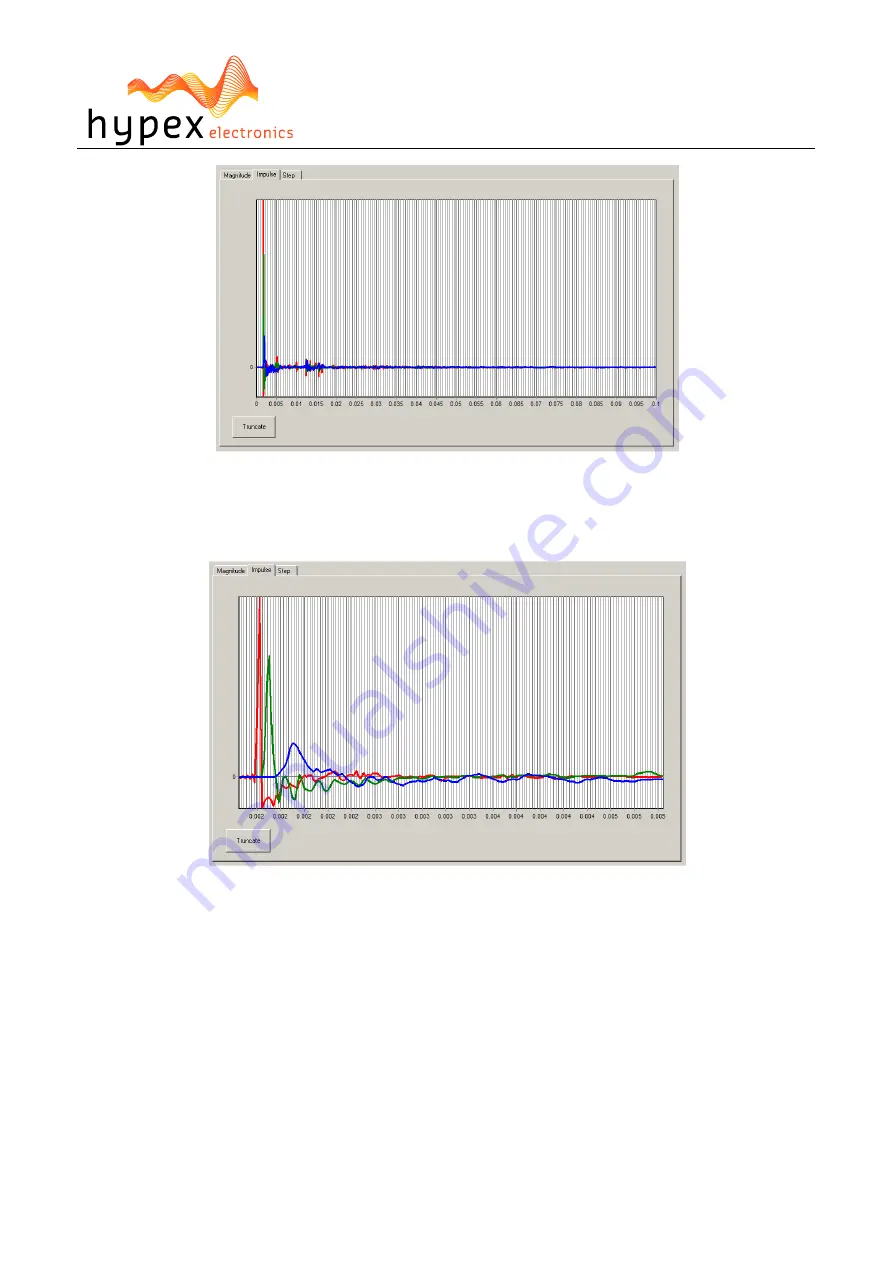
Figure 22
The first echo is apparent at 5ms. Zoom in until you see only the anechoic portion of the impulse
response. Dragging the mouse, left-button down, from left to right marks a zoom area. Dragging
from right to left zooms out. Dragging with the right button down pans the plot left and right.
Figure 23
Click “truncate”. Anything currently outside the display is drawn in grey and not processed. You will
notice that in the frequency graph a portion of the low-frequency response is also drawn in grey.
This is to remind the user that insufficient information is available to make *any* correction below
this frequency. A way of obtaining quasi anechoic low-frequency measurements is making close-up
measurements. Working with such measurements requires a good deal of interpretation but it is
doable.
Important: Avoid making any corrections for which no anechoic data is available. If reflections are
included, they are guaranteed to dominate the measurement at low frequencies, and you will end up
making corrections for circumstances that are highly specific to the room in which the measurement
was made. Power-response data can only be made in a proper echo chamber or preferably, by collat-
ing a large number of anechoic off-axis measurements. A reverberant measurement in a normal live
room just won’t do.

