User manual R3
DLCP
- 26 -
4.8.3
Result
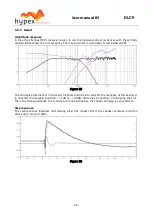
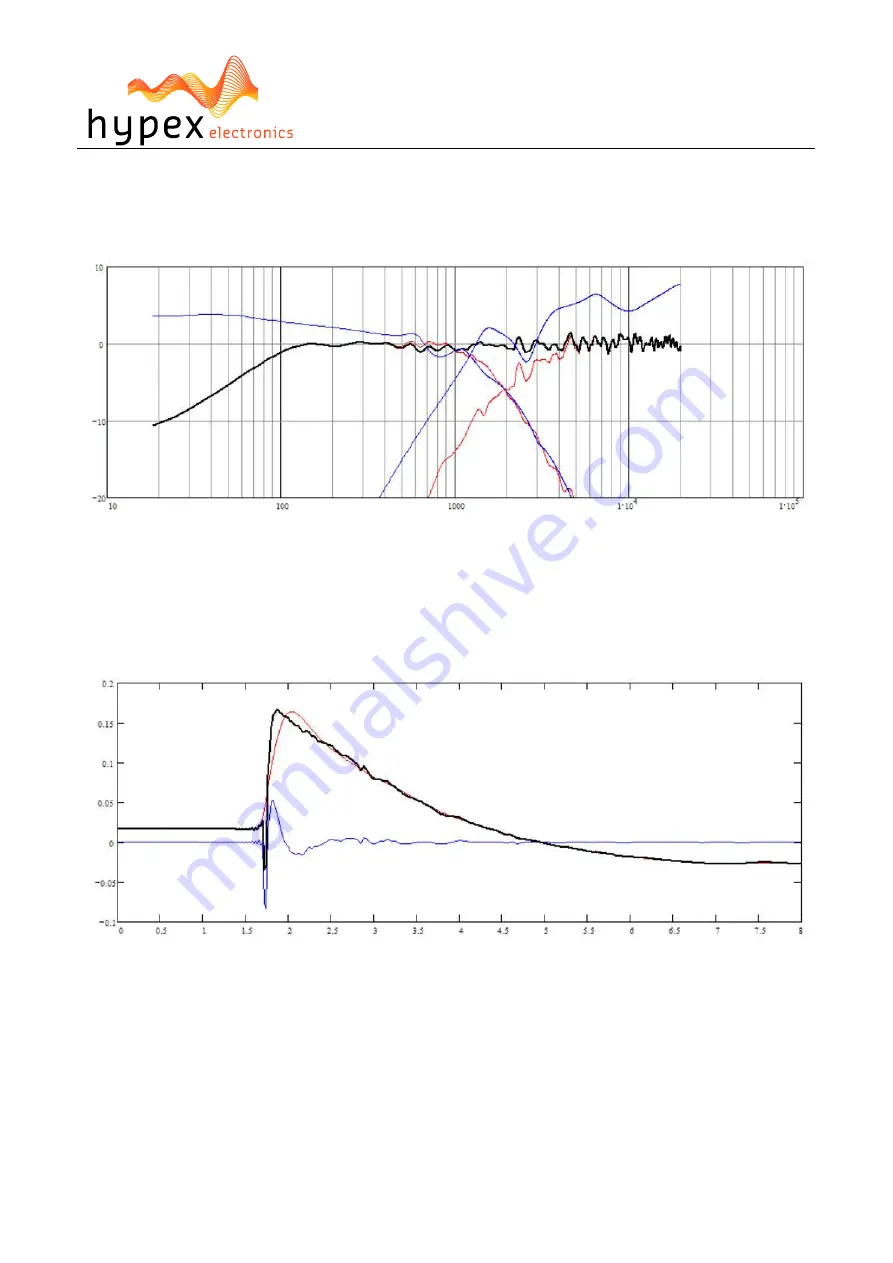
Amplitude response
In blue the effective DSP crossover curves. In red the individual driver responses with these filters
applied. Black shows the sum response. The measurement is valid down to just below 200Hz.
Figure 25
The strategic placement of in total just 32 poles and 32 zeros corrects the response of this seeming-
ly hopeless loudspeaker to within +/-1dB or +/-0.3dB (3rdoctave smoothing). Considering that fur-
ther correction would back-fire in terms of off-axis behaviour, the chosen strategy is very efficient.
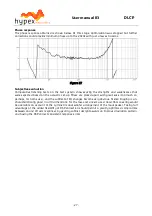
Step response
The step response indicates that already after this modest effort, the speaker achieves minimum
phase up to around 10kHz.
Figure 26

