48
www.i-sens.com
www.i-sens.com
49
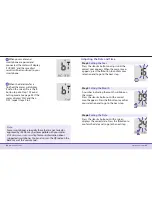
Step 3
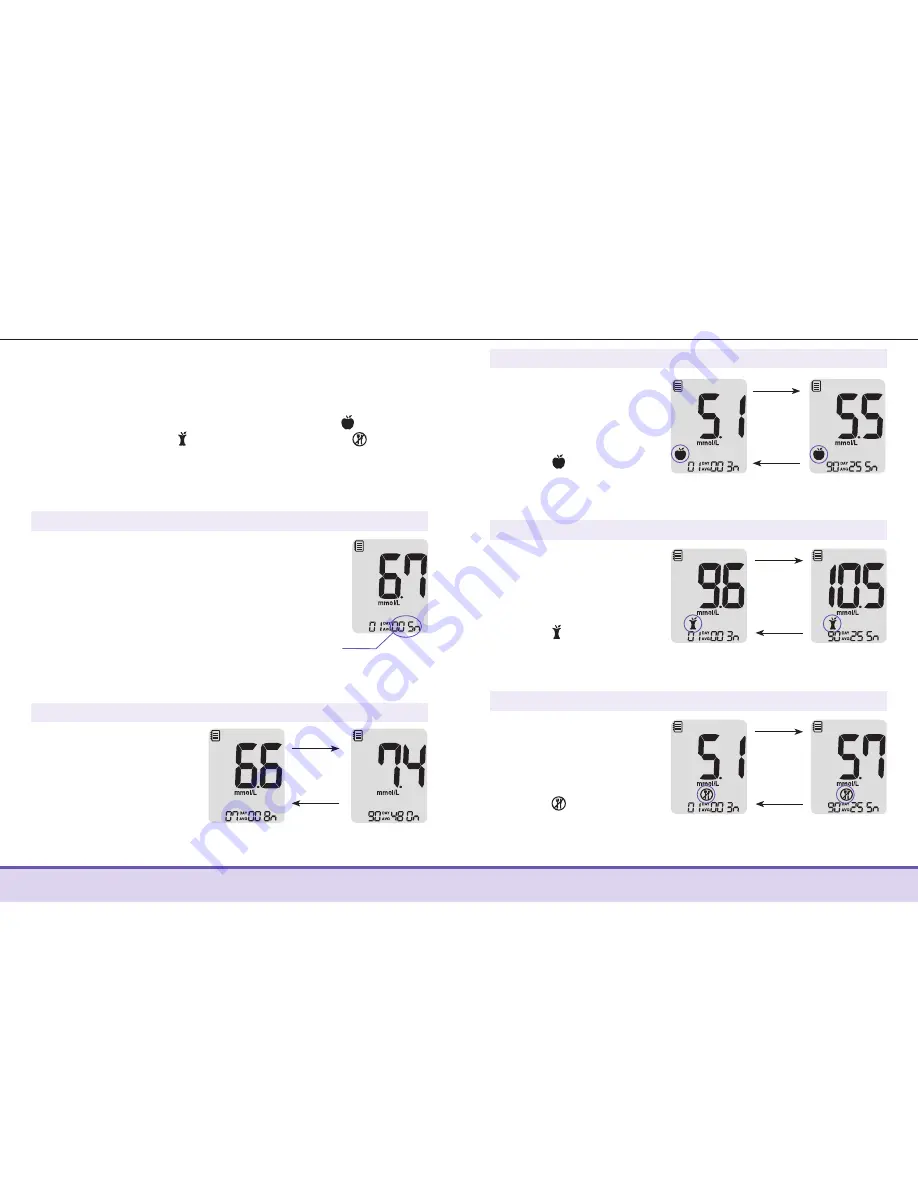
Viewing Pre-meal Averages
Repeatedly press the
◀
button to view 1, 7, 14,
30 and 90-day average
values and the number of
tests performed pre-meals
with the symbol for
the last test period.
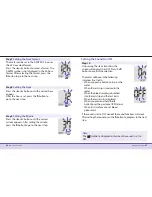
Step 4
Viewing Post-meal Averages
Press the
◀
button to
view 1, 7, 14, 30 and
90-day average values
and the number of tests
performed post-meals
with the symbol for
the last test period.
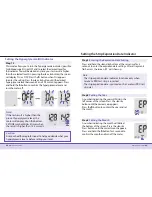
Step 5
Viewing Fasting Averages
Press the
◀
button to
view 1,7, 14, 30 and
90-day average values
and the number of tests
performed during fasting
with the symbol for
the last test period.
▶
button
▶
button
◀
button
◀
button
Post-meal
average
(1, 7, 14, 30,
90 days)
Fasting
average
(1, 7, 14, 30,
90 days)
▶
button
◀
button
Pre-meal
average
(1, 7, 14, 30, 90
days)
Meter Memory
Step 1
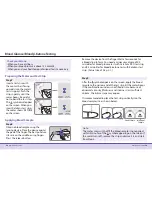
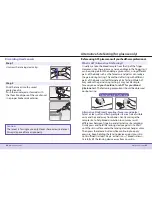
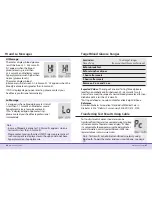
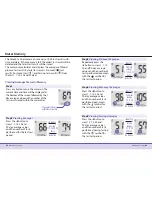
Press any button to turn the meter on. The
current date and time will be displayed at
the bottom of the screen followed by the 1
day average value and the number of the
test results saved within the current day.
Viewing Averages Stored in Memory
The CareSens Dual meter can save up to 1,000 test results with
time and date. If the memory is full, the oldest test result will be
deleted and the latest test result will be stored.
The meter only calculates and displays the averages of blood
glucose test results by total test results, Pre-meal ( ) test
results, Post-meal test ( ), and Fasting test results ( ) from
the last 1, 7, 14, 30 and 90 days.
The number of tests
within the current day
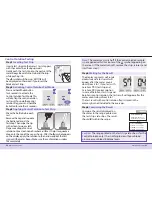
Step 2
Viewing Averages
Press the
◀
button to
view 1, 7, 14, 30 and
90-day average values
and the number of tests
performed for the last test
period.
▶
button
◀
button
Average
(1, 7, 14, 30, 90
days)


