Operator's Manual
95
QC Data
,
continued
5. Database
L-J Chart
1. Select
MENU > QC > L-J Chart
.
2. Select QC Lot, Parameter and Level on the top of the screen.
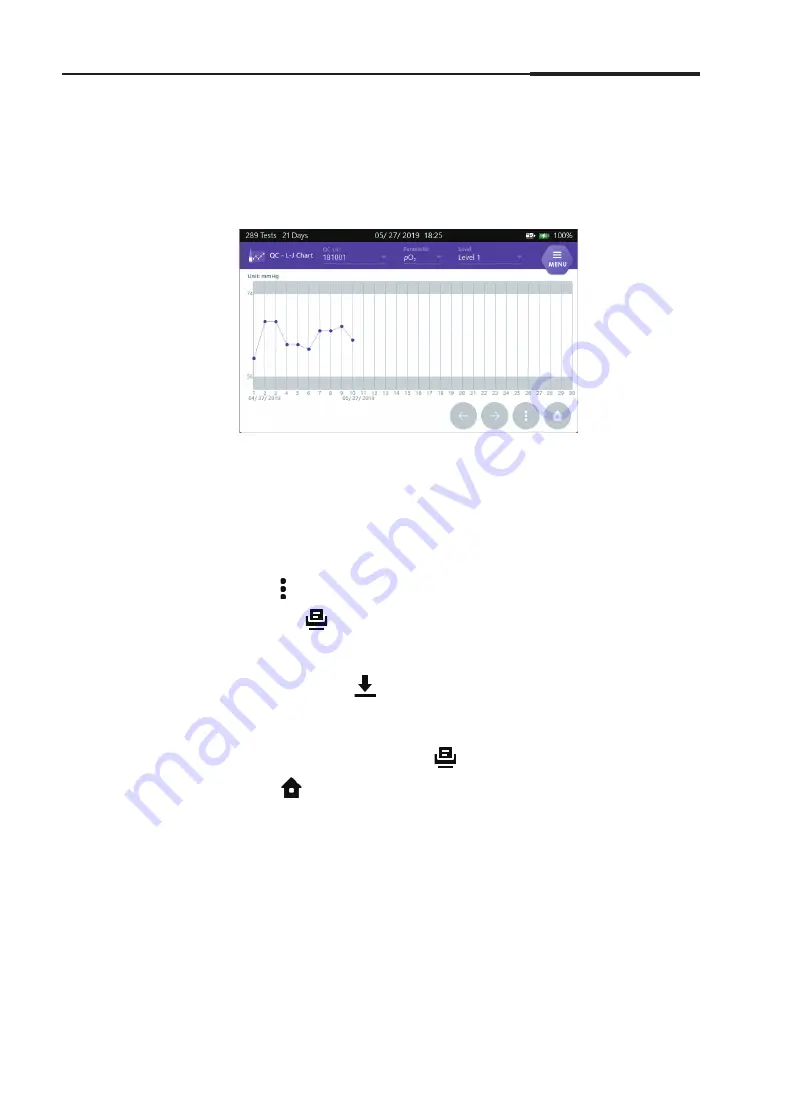
The following chart appears for the selected parameters.
Note:
The most recent data is indicated to the right and values (up to 30)
are displayed in the chart.
The configured SD value from the
QC - L-J Chart Setup
is
indicated with shaded lines, and the data which are out of SD range
are marked as red dot.
3. Press and the following functions can be performed.
•
Press
and the QC chart data will be printed through configured
external printer.
•
To copy the QC chart data, insert a USB memory in the USB port
and press the
button.
Note:
If the analyzer is not connected to the network or the external
printer is not installed, the
button will be deactivated.
4. Press
to exit to the main screen.
Summary of Contents for i-SmartCare 10
Page 1: ...PZA1O7619 REV7 2020 12 Operator s Manual Operator s Manual...
Page 3: ......
Page 4: ...Please take time to read this operator s manual before setting up and operating the analyzer...
Page 5: ......
Page 8: ...1 Introduction 1 Introduction Safety 8 Symbols and Terminology 10 Product Description 13...
Page 27: ...2 Installation 26 i SmartCare 10 Blood Gas Analyzer This page is intentionally left blank...
Page 31: ...30 i SmartCare 10 Blood Gas Analyzer Screen Menu continued 3 Instrument Settings Menu options...
Page 68: ...4 Sample Analysis 4 Sample Analysis Start Analysis 68 Blood Sample 69 QC Sample 78...
Page 86: ...5 Database 5 Database Sample Data 86 QC Data 90 Calibration Data 96 Cartridge Data 97...
Page 100: ...6 Shutdown 6 Shutdown Analyzer Shutdown 100 Power Recovery 102...
Page 116: ...8 Troubleshooting 8 Troubleshooting Troubleshooting 116 Error Code 122...


