Copyright Velocomp LLP 2008-2010
21
the iAero computes the cumulative amount of time you gain or lose, moment-by-moment,
due to deviations from your baseline CdA.
The iAero computes the net time effect of better-and-worse ride positions and displays the
cumulative
Time Advantage number in the bottom window of your iAero (the bottom
window alternates automatically between cadence, HR, Continuous CdA, and Time
Advantage).
In short, Continuous CdA make it possible for the iAero to determine the corresponding
Time Advantage gained and lost by changes in aerodynamic drag throughout your ride.
Graphical Example
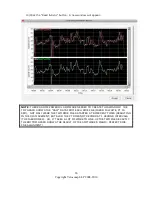
Here is a graphical depiction of an actual iAero ride with a CinQo DFPM.
This data was captured in an iAero ride file and was analyzed using features in the iBike
software we’ll discuss later on in this manual.
The top graph shows CdA versus distance. The middle graph shows Time Advantage vs.
distance, and the bottom graph shows speed vs. distance.
This ride was about 29 miles long. In the top window you see in purple the rider’s CdA vs
distance. Note that an imaginary horizontal line can be drawn through the purple graph at
about CdA = 0.39.
The value CdA = 0.39 is this rider’s baseline CdA value as
determined by the calibration ride done previously with the CinQo.
For the first 4.4 miles of this ride the rider had CdA measurements that, most often, were
above his normal value of 0.39.
A higher than normal CdA means the rider was relatively
less aerodynamic and that he lost time due to his relatively poor riding position
. How much


