Disk Space (MSG)
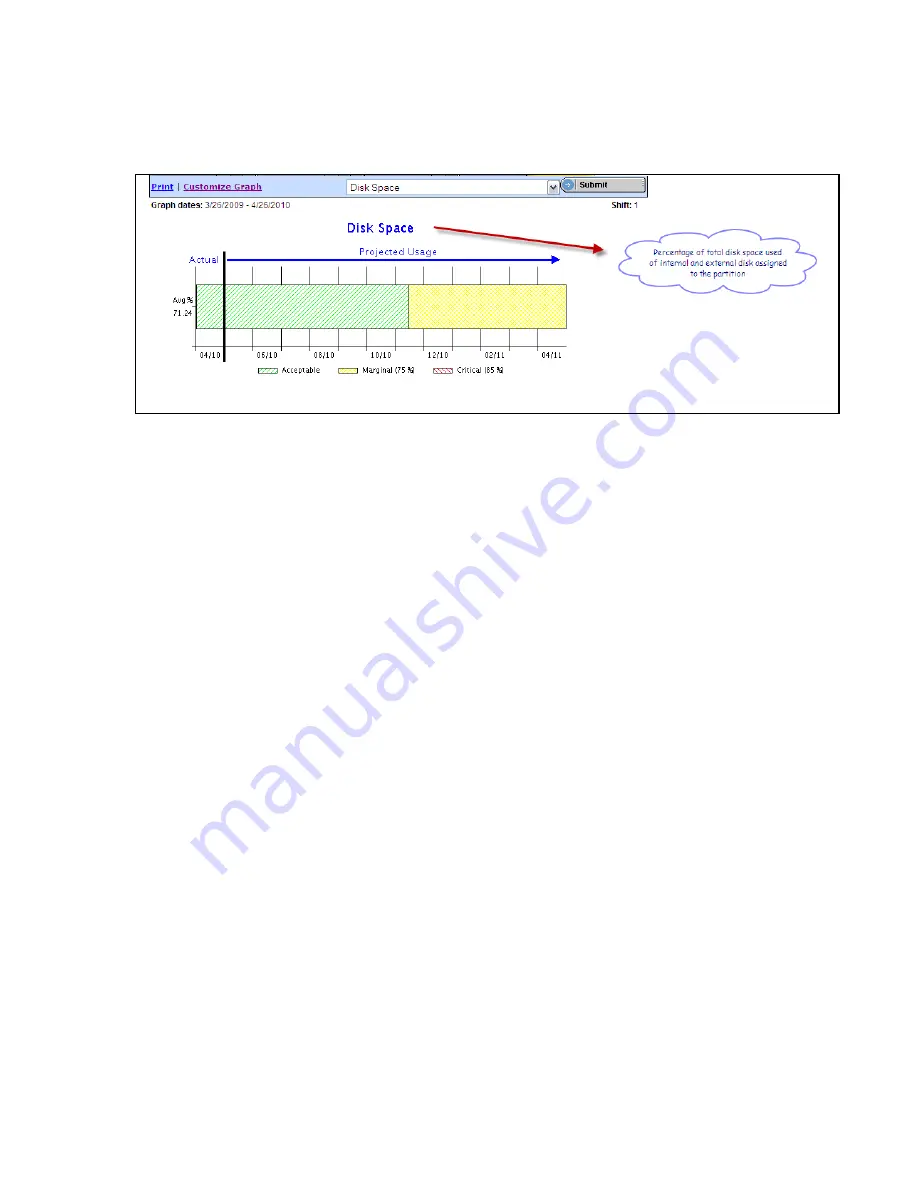
Disk Space Graph (MSG)
This calculation represents a combined utilization in terms of percentage full for the internal and
external disk assigned to the partition.
This graphic uses the colors to indicate the current status of the resource and the projected status
for the next 12 months.
Green bar – resource utilization is within good performance guidelines
Yellow bar – resource utilization is marginal, you may be experiencing intermittent
performance degradation due to the resource constraint
Red bar – resource utilization is critical, the resource utilization is beyond the guidelines
for good performance and corrective action should be taken.
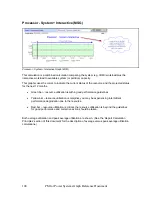
102
PM for Power Systems Graph Reference Document


