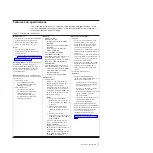
configuration information on a scheduled basis so that the information is available
to you and your support representative. It uses minimal system resources, and is
available free of charge. For more information and to download IBM Electronic
Service Agent, go to http://www.ibm.com/support/entry/portal/
Open_service_request/ .
v
POST error codes and event logs
The power-on self-test (POST) generates messages to indicate successful test
completion or the detection of a problem. For more information, see “Event logs”
and “POST” on page 18.
v
Checkpoint codes
Checkpoint codes track the progress of POST routines at system startup or
reset. Checkpoint codes are shown on the checkpoint code display, which is on
the light path diagnostics panel.
Event logs
Error codes and messages are displayed in the following types of event logs. Some
of the error codes and messages in the logs are abbreviated. When you are
troubleshooting PCI-X slots, note that the event logs report the PCI-X buses
numerically. The numerical assignments vary depending on the configuration. You
can check the assignments by running the Setup utility (see “Using the Setup utility”
on page 345 for more information).
v
POST event log:
This log contains the three most recent error codes and
messages that were generated during POST. You can view the contents of the
POST event log through the Setup utility.
v
System-event log:
This log contains messages that were generated during
POST and all system status messages from the service processor. You can view
the contents of the system-event log from the Setup utility.
The system-event log is limited in size. When it is full, new entries will not
overwrite existing entries; therefore, you must periodically clear the system-event
log through the Setup utility. When you are troubleshooting an error, be sure to
clear the system-event log so that you can find current errors more easily.
Each system-event log entry is displayed on its own page. Messages are listed
on the left side of the screen, and details about the selected message are
displayed on the right side of the screen. To move from one entry to the next,
use the Up Arrow (
↑
) and Down Arrow (
↓
) keys.
The system-event log indicates an assertion event when an event has occurred.
It indicates a deassertion event when the event is no longer occurring.
v
Integrated management module II (IMM2) event log:
This log contains a
filtered subset of all IMM2, POST, and system management interrupt (SMI)
events. You can view the IMM2 event log through the IMM2 web interface and
through the Dynamic System Analysis (DSA) program (as the ASM event log).
v
DSA log:
This log is generated by the Dynamic System Analysis (DSA) program,
and it is a chronologically ordered merge of the system-event log (as the IPMI
event log), the IMM2 chassis-event log (as the ASM event log), and the
operating-system event logs. You can view the DSA log through the DSA
program.
Viewing event logs from the Setup utility
To view the error logs, complete the following steps:
1. Turn on the server.
16
System x iDataPlex dx360 M4 Types 7912 and 7913: Problem Determination and Service Guide
Summary of Contents for System x iDataPlex dx360 M4 7912
Page 1: ...System x iDataPlex dx360 M4 Types 7912 and 7913 Problem Determination and Service Guide...
Page 2: ......
Page 3: ...System x iDataPlex dx360 M4 Types 7912 and 7913 Problem Determination and Service Guide...
Page 22: ...4 System x iDataPlex dx360 M4 Types 7912 and 7913 Problem Determination and Service Guide...
Page 278: ...260 System x iDataPlex dx360 M4 Types 7912 and 7913 Problem Determination and Service Guide...
Page 292: ...274 System x iDataPlex dx360 M4 Types 7912 and 7913 Problem Determination and Service Guide...
Page 392: ...374 System x iDataPlex dx360 M4 Types 7912 and 7913 Problem Determination and Service Guide...
Page 399: ......
Page 400: ...Part Number 46W8218 Printed in USA 1P P N 46W8218...

