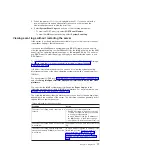
2. When the prompt
<F1> Setup
is displayed, press F1. If you have set both a
power-on password and an administrator password, you must type the
administrator password to view the error logs.
3. Select
System Event Logs
and use one of the following procedures:
v
To view the POST error log, select
POST Event Viewers
.
v
To view the IMM2 system-event log, select
System Event Log
.
Viewing event logs without restarting the server
If the server is not hung, methods are available for you to view one or more event
logs without having to restart the server.
If you have installed Dynamic System Analysis (DSA) Portable, you can use it to
view the system-event log (as the IPMI event log), the IMM2 event log (as the ASM
event log), the operating-system event logs, or the merged DSA log. You can also
use DSA Preboot to view these logs, although you must restart the server to use
DSA Preboot.
To install DSA Portable, or DSA Preboot or to download a DSA Preboot CD image,
go to http://www.ibm.com/support/entry/portal/docdisplay?brand=5000008
&lndocid=SERV-DSA.
If IPMItool is installed in the server, you can use it to view the system-event log.
Most recent versions of the Linux operating system come with a current version of
IPMItool.
For an overview of IPMI, go to http://www.ibm.com/developerworks/linux/blueprints/
and click
Using Intelligent Platform Management Interface (IPMI) on IBM Linux
platforms
.
You can view the IMM2 system event log through the
Event Log
link in the
integrated management module II (IMM2) web interface. For more information, see
“Logging on to the web interface” on page 353.
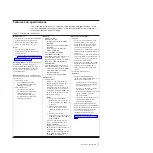
The following table describes the methods that you can use to view the event logs,
depending on the condition of the server. The first three conditions generally do not
require that you restart the server.
Table 3. Methods for viewing event logs
Condition
Action
The server is not hung and is connected to a
network.
Use any of the following methods:
v
Run DSA Portable to view the event logs
or create an output file that you can send
to a support representative.
v
In a web browser, type the IP address of
the IMM2 and go to the Event Log page.
v
Use IPMItool to view the system-event log.
The server is not hung and is not connected
to a network.
Use IPMItool locally to view the system-event
log.
The server is not hung and the integrated
management module II (IMM2) is connected
to a network.
In a web browser, type the IP address for the
IMM2 and go to the Event Log page. For
more information, see“Obtaining the IP
address for the IMM2” on page 352 and
“Logging on to the web interface” on page
353.
Chapter 3. Diagnostics
17
Summary of Contents for System x iDataPlex dx360 M4 7912
Page 1: ...System x iDataPlex dx360 M4 Types 7912 and 7913 Problem Determination and Service Guide...
Page 2: ......
Page 3: ...System x iDataPlex dx360 M4 Types 7912 and 7913 Problem Determination and Service Guide...
Page 22: ...4 System x iDataPlex dx360 M4 Types 7912 and 7913 Problem Determination and Service Guide...
Page 278: ...260 System x iDataPlex dx360 M4 Types 7912 and 7913 Problem Determination and Service Guide...
Page 292: ...274 System x iDataPlex dx360 M4 Types 7912 and 7913 Problem Determination and Service Guide...
Page 392: ...374 System x iDataPlex dx360 M4 Types 7912 and 7913 Problem Determination and Service Guide...
Page 399: ......
Page 400: ...Part Number 46W8218 Printed in USA 1P P N 46W8218...

