AFL2-15A-H61
Page 114
6.2.2 Chart Panel
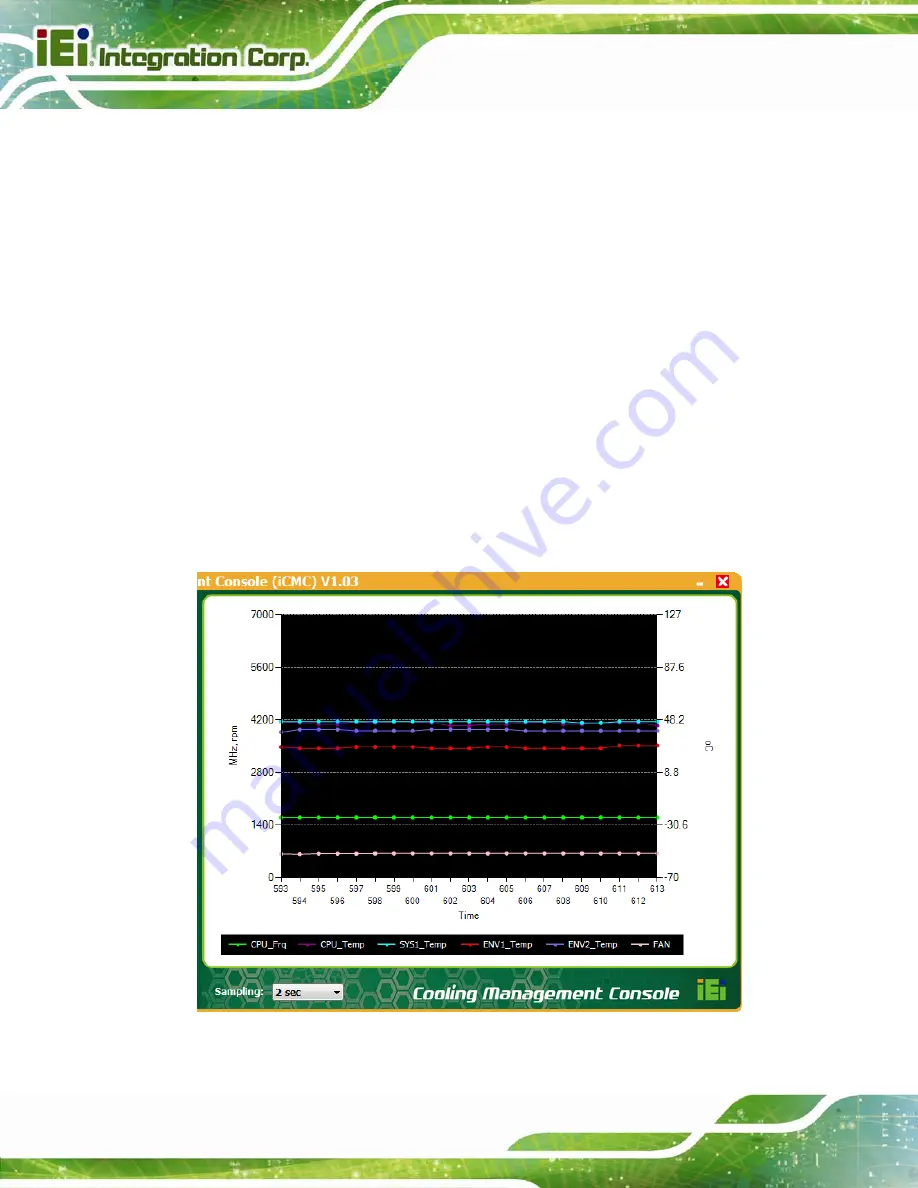
shows the chart panel interface. The line chart is used to visualize the system
data listed in the information panel. The following information is displayed in different color
lines:
Green
: CPU frequency
Pink
: CPU temperature
Blue
: System temperature 1
Yellow
: Environment temperature 1
Red
: Environment temperature 2
Purple
: Fan speed
The y-axis on the left represents the values for CPU frequency (MHz) and fan speed
(RPM) while the y-axis on the right represents the values for CPU, system and
environment temperatures.
Figure 6-9: iCMC – Chart Panel
Summary of Contents for AFL2-15A-H61 series
Page 14: ...AFL2 15A H61 Page XIV Figure C 42 Disable Automatically Restart 188...
Page 18: ...AFL2 15A H61 Page 1 1 Introduction Chapter 1...
Page 31: ...AFL2 15A H61 Page 14 2 Unpacking Chapter 2...
Page 36: ...AFL2 15A H61 Page 19 3 Installation Chapter 3...
Page 61: ...AFL2 15A H61 Page 44 4 BIOS Setup Chapter 4...
Page 97: ...AFL2 15A H61 Page 80 5 Software Drivers Chapter 5...
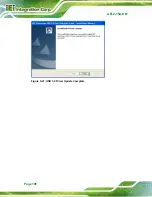
Page 123: ...AFL2 15A H61 Page 106 Figure 5 41 USB 3 0 Driver Update Complete...
Page 124: ...AFL2 15A H61 Page 107 6 System Monitoring iCMC Chapter 6...
Page 133: ...AFL2 15A H61 Page 116 7 System Maintenance Chapter 7...
Page 142: ...AFL2 15A H61 Page 125 8 Interface Connectors Chapter 8...
Page 160: ...AFL2 15A H61 Page 143 A Safety Precautions Appendix A...
Page 165: ...AFL2 15A H61 Page 148 B BIOS Menu Options Appendix B...
Page 168: ...AFL2 15A H61 Page 151 Appendix C C One Key Recovery...
Page 176: ...AFL2 15A H61 Page 159 Figure C 5 Partition Creation Commands...
Page 210: ...AFL2 15A H61 Page 193 D Hazardous Materials Disclosure Appendix D...


