Selenio
TM
BNP User Guide, Release 3.7.1
30
- Grooming Tab
BNP
Element Manager
Status Bar
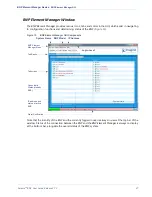
The status bar at the bottom of the BNP
Element Manager
always remains in view to report status
information about the BNP. Color coding (
) indicates the current, highest-level severity of the
situation reported for connectivity and alarms.
Connectivity
Status of connectivity to the BNP is reported at the left portion of the status bar, where you can view
the currently connected IP address of the BNP, and current status of connectivity between the BNP and
the
BNP Element Manager
as either green (good) or red (error).
Alarms
Status of most critical event reported by the BNP is displayed as a text string and color code (
) in
the middle section of the status bar.
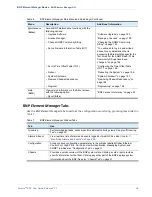
Table 8.
BNP
Element Manager
System Status
Color
Meaning
Green
Informational alert or event.
Yellow
Minor alert or event may require operator action.
Pink
Major alert or event requires operator action.
Red
Critical error has occurred and operator intervention is needed.
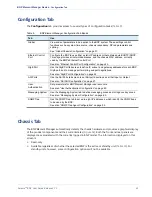
Grooming Tab
The
Grooming
tab screen provides access to the mapping page and the bitrate monitoring pages. For
more information about the Grooming tab, see the following topics:
•
“Grooming - Mapping” on page 104.
•
“Monitoring Bitrates” on page 182.
Alarms & Events tab
The
Alarms & Events
tab provides information about the current state of the system and is viewable at
any time. For more information about the Alarms & Event tab, see

