34
The current plot format is displayed
as a menu. Use the special function
keys to change the format settings.
Plot Types
Press
F1
in the plot format menu to
select one of four plot types. Press
ENTER
or
CLEAR
to exit the menu.
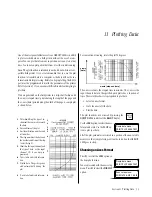
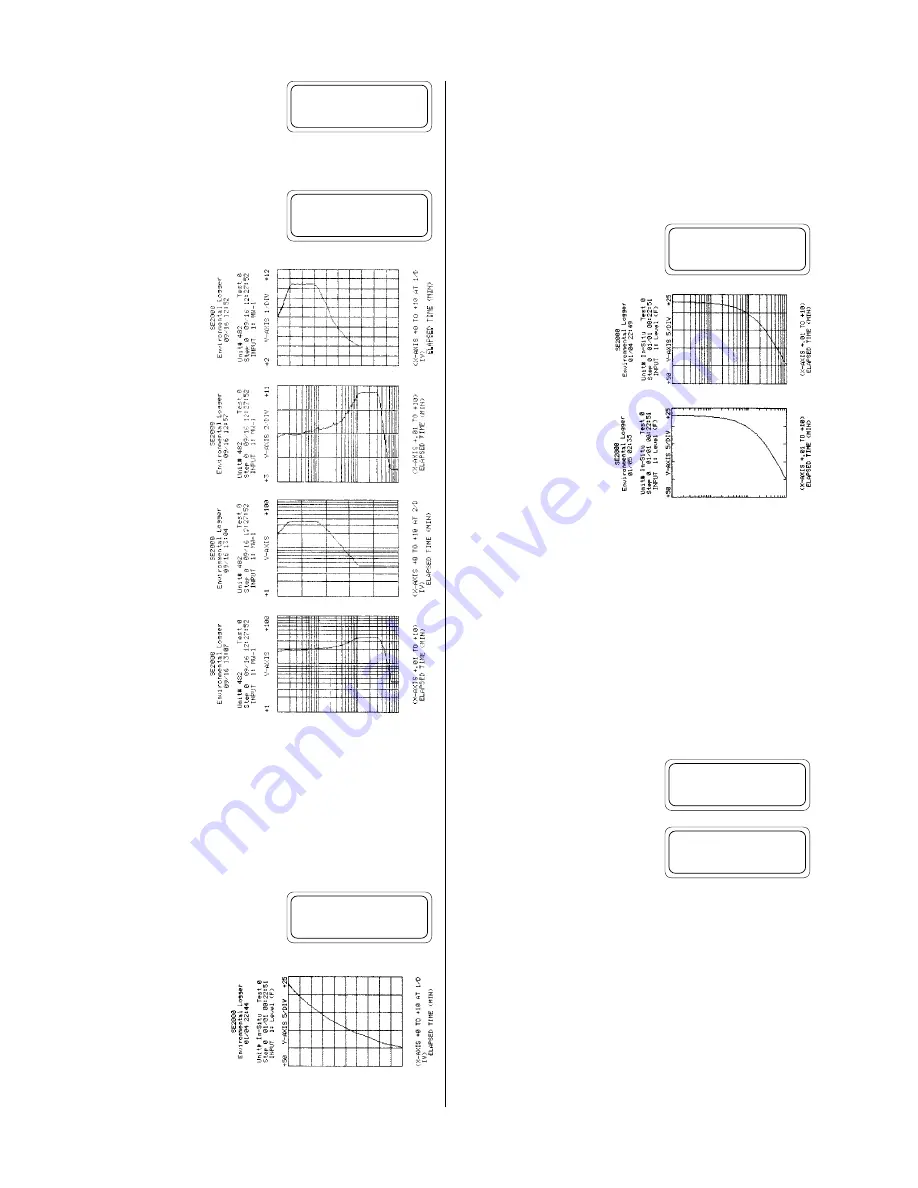
LINEAR
specifies a
plot with both the x-
axis and the y-axis
having linear divi-
sions.
LOG-LIN
specifies a
semi-log plot with
logarithmic x-axis di-
visions and linear y-
axis divisions.
LIN-LOG
specifies a
semi-log plot with
linear x-axis divisions
and logarithmic y-
axis divisions.
LOG-LOG
selects a
plot with both the x-
axis and the y-axis
having logarithmic
divisions. In the log-
log mode, the y-axis
represents
change
in the recorded value from the initial value at
time zero.
These examples show the same data plotted in the different axes
formats. The usefulness of each plot type depends on the type of
monitoring or test you have recorded.
Plot Sizes
Press
F2
in the plot format menu to
select between single-
PAGE
size and
strip-
CHART
size. Press
ENTER
or
CLEAR
to exit the menu.
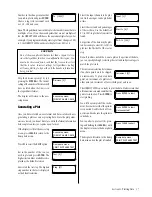
You have already seen ex-
amples of the
PAGE
size.
The actual size of plot will
vary depending on the
printer you choose. On a
printer that uses 8 ½ x 11 inch paper such as In-Situ’s GFP-80, the
plot will fit on a single page.
The
CHART
selection produces a plot that is seven to ten times the
length of the page mode. The y-axis width of the plot remains the
same. The chart mode is particularly useful when you need a com-
plete plot of long-term data but still would like to see some detail in
short-term variations.
Division Markings
Press
F3
in the plot format menu to
select between
TICS
and
GRID
divi-
sion markings.
Our previous examples
have all been plotted in the
GRID
mode.
The
TICS
mode removes
the center grid and labels
the divisions with tic marks
along the outside border.
Scaling the Axes
Once you have selected an axes format, you must set the scale of the
x- and y-axes to match the data you wish to plot. Improper scaling
can result in missed features and even blank graphs.
You can determine a starting point for axes scaling by identifying
the minimum and maximum values recorded for the input channel
you wish to plot. You can use the
VIEW DATA
function to scan
through the data on the LCD display, or the
function with its
increment option to generate an abbreviated printout of the data.
If you are still at the plot format
menu, press
CLEAR
.
The display will return to the axes
setup menu.
X-Axis Scaling
The x-axis always represents the elapsed time in minutes and may
have linear or logarithmic divisions depending upon your selection
of the axes format. Since the requirements for each format are
unique, they will be discussed separately.
Linear X-Axis Scaling
Scaling of a linear x-axis requires the entry of three parameters:
Section 11: Plotting Data
Plot format:
LINEAR PAGE GRID
Plot format:
LINEAR PAGE GRID
Plot format:
LINEAR PAGE GRID
Plot format:
SEM-LOG PAGE GRID
Plot format:
SEM-LOG PAGE GRID
Axes setup menu:
FORMAT X-AXIS Y-AXIS


