36
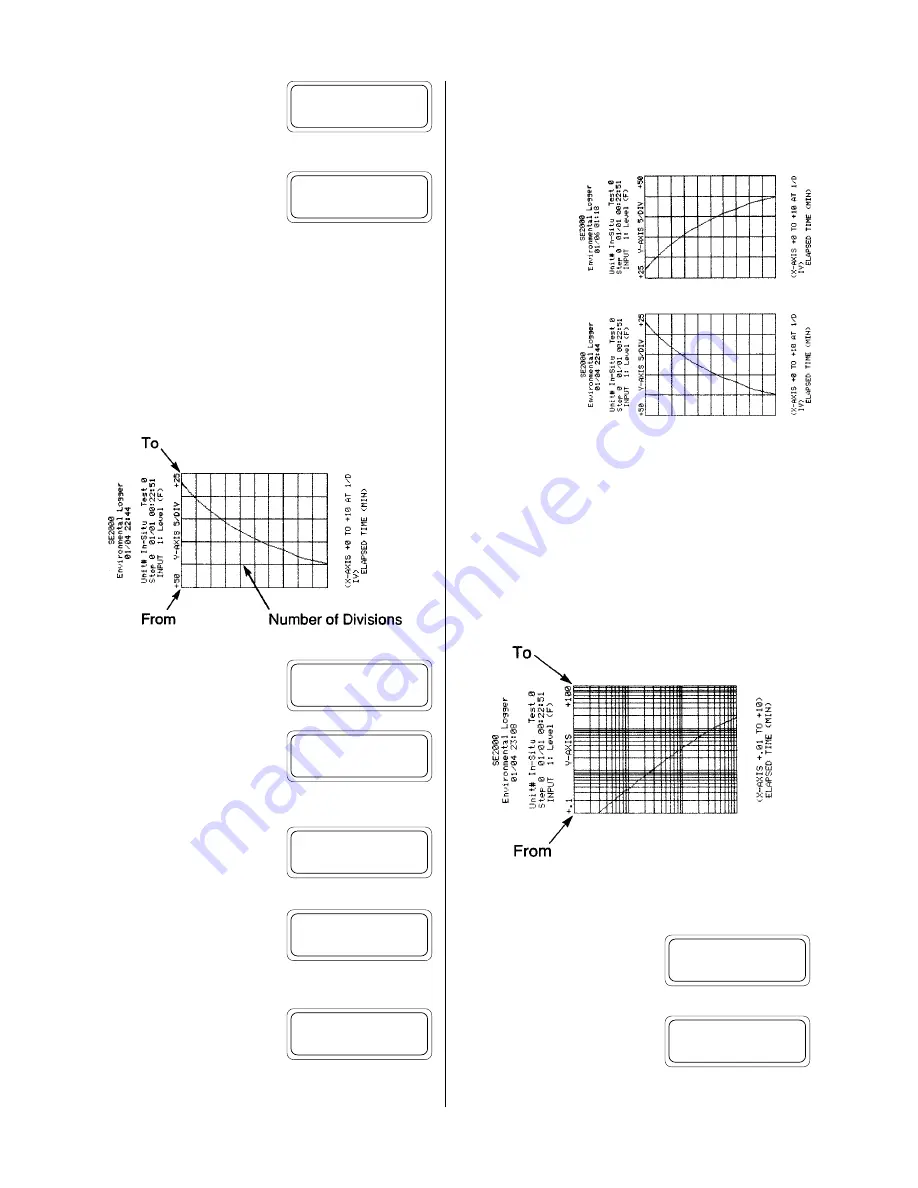
Skip the divisions prompt by just
pressing the
ENTER
key. The current
setting of the number of divisions will
have no effect when the x-axis is in a logarithmic format.
The display will return to the axes
setup menu.
Y-Axis Scaling
The y-axis represents input channel data in the specified units plot-
ted as a function of time. The y-axis may have linear or logarithmic
divisions depending upon your selection of the axes format.
Linear Y-Axis Scaling
The y-axis will have linear divisions when either the linear or semi-
log formats have been selected. Scaling of a linear y-axis requires
the entry of three parameters:
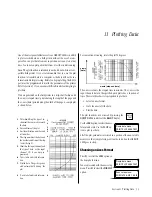
To scale the y-axis, press
F3
to select
the
Y-AXIS
option from the axes
setup menu.
Key in the y-axis value, in the same
units that the data is in, that you wish
the plot to begin
from
and press
EN-
TER
.
Next key in the value that you wish
the y-axis to extend
to
. You will not
be allowed to enter a value that is
equal to your
from
setting.
Lastly, key in the number of divisions
you want to have the y-axis divided
into. The HERMIT 2000 will auto-
matically scale the divisions based on your
from
and
to
entries.
The display will return to the axes
setup menu.
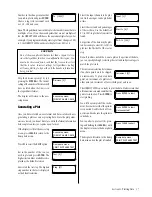
There are no restrictions on the range of the y-axis endpoints in
either the positive or negative direction. You can even swap the po-
larity of the endpoints.
For example, if the
data were surface
water levels, we
might prefer that
the y-axis be ori-
ented convention-
ally with increasing
levels going up.
However, if the same
data were top of cas-
ing readings from a
pump test, we might
prefer that increas-
ing levels be oriented downward. The HERMIT 2000 will allow you
to scale the y-axis either way on both the linear and semi-log for-
mats.
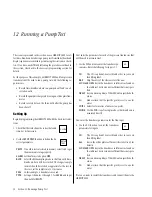
Logarithmic Y-Axis Scaling
Selection of the log-log axes format causes the y-axis to be scaled
with logarithmic divisions, and the data to be plotted as the absolute
value of the change in data since time zero. This plot format is aimed
at, but not restricted to, type curve generation for pump tests. Scal-
ing of the logarithmic y-axis requires the entry of two parameters:
The number of log cycle divisions is calculated automatically by the
HERMIT 2000.
To scale the y-axis, press
F3
to select
the
Y-AXIS
option from the axes
setup menu.
Key in the change in value that you
wish to begin plotting
from
and press
ENTER
. Choose a log cycle incre-
ment such as .001, .01, .1, and so on.
Section 11: Plotting Data
Divisions [1]?
_
Axes setup menu:
FORMAT X-AXIS Y-AXIS
Axes setup menu:
FORMAT X-AXIS Y-AXIS
From [0]?
_
To [1000]?
_
Divisions [1]?
_
Axes setup menu:
FORMAT X-AXIS Y-AXIS
Axes setup menu:
FORMAT X-AXIS Y-AXIS
From [0]?
_


