35
To scale the x-axis, press
F2
to select
the X-AXIS option from the axes
setup menu.
Key in the elapsed time, in minutes,
that you wish to begin plotting
from
and press
ENTER
. You will not be
allowed to enter a value less than zero, or a value that is greater
than or equal to the current
to
setting.
Next key in the elapsed time, in min-
utes, that you wish to plot
to
and
press
ENTER
. You will not be allowed
to enter a value that is less than or equal to your
from
setting.
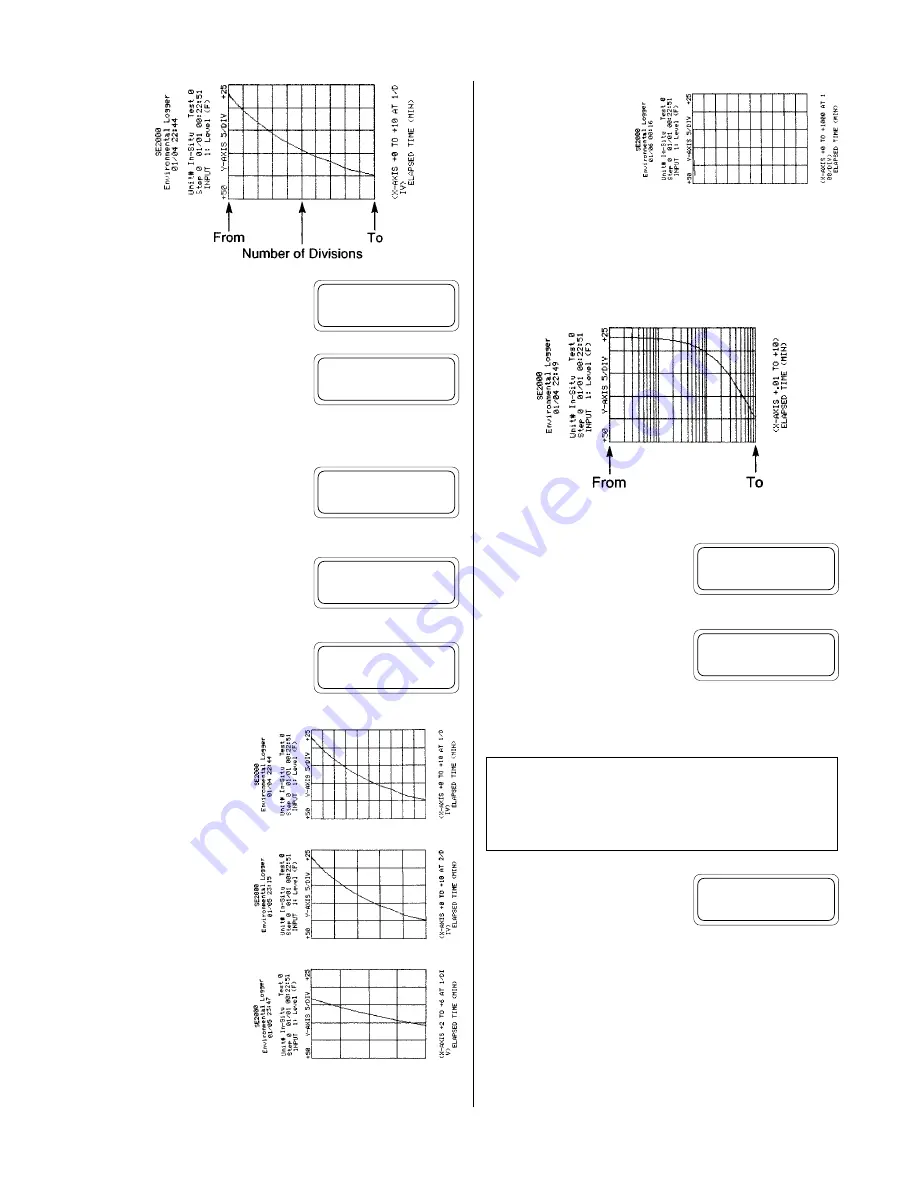
Lastly, key in the number of divisions
you want to have the x-axis divided
into. The HERMIT 2000 will auto-
matically scale the divisions based on your
from
and
to
entries.
The display will return to the axes
setup menu.
The selection of the number of divisions is a matter of convenience.
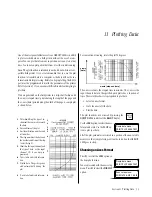
This sample plot was
made from 0 to 10 min-
utes with 10 divisions,
resulting in 1-minute
intervals per division.
Here the same data are
plotted with only 5 divi-
sions, resulting in 2
minutes per division.
You are not restricted to
plotting an entire test at
one time, or to plotting
from time 0. You can
“blow up” any portion
of the test. Here, for ex-
ample, the data are plot-
ted from 2 to 6 minutes, enlarging that portion of the test for easier
viewing.
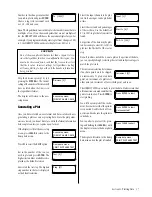
This is an example of
what might be considered
a poor choice of x-axis
scaling. The time scale is
so long that little infor-
mation can be extracted
from the plot.
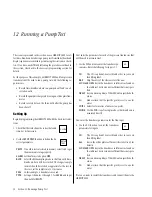
Logarithmic X-axis Scaling
Scaling of a logarithmic x-axis in the semi-log or log-log modes
requires the entry of only two parameters:
The number of log cycle divisions is calculated automatically by the
HERMIT 2000.
To scale the x-axis, press
F2
to select
the
X-AXIS
option from the axes
setup menu.
Key in the elapsed time, in minutes,
that you wish to begin plotting
from
and press
ENTER
. Choose a log cycle
increment such as .001, .01, .1, and
so on. You will not be allowed to enter a value greater than or equal
to the current
to
setting.
Next key in the elapsed time, in min-
utes, that you wish to plot
to
and press
ENTER
. Choose a log cycle increment
such as 10, 100, 1000, and so on. You will not be allowed to enter a
value less than or equal to your
from
setting.
Note
: The logarithmic x-axis always plots between divisions that are
multiples of ten. If you choose endpoints that are not multiples of
ten, the HERMIT 2000 will choose the nearest multiples for you. For
example, if you programmed endpoints to plot from .02 to 5 min-
utes, the HERMIT 2000 would generate a plot from .01 to 10 min-
utes.
Section 11: Plotting Data
Axes setup menu:
FORMAT X-AXIS Y-AXIS
From [0]?
_
To [1000]?
_
Divisions [1]?
_
Axes setup menu:
FORMAT X-AXIS Y-AXIS
Axes setup menu:
FORMAT X-AXIS Y-AXIS
From [0]?
_
CAUTION
Do not attempt to plot from zero since LOG (0) is undefined.
Plotting from zero in the log formats will cause plotting to
stop with only the header information being printed.
To [1000]?
_


