Doc
#
E159708
B-15
B: Three-Phase Power Measurement
Electro
Industries/GaugeTech
™
Powered by Innovation™
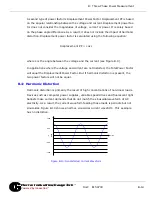
Figure B.11 shows a current waveform with a slight amount of harmonic distortion.
The waveform is still periodic and is fluctuating at the normal 60 Hz frequency.
However, the waveform is not a smooth sinusoidal form as seen in Figure B.10.
Figure B.11: Distorted Current Waveform
The distortion observed in Figure B.11 can be modeled as the sum of several sinusoi-
dal waveforms of frequencies that are multiples of the fundamental 60 Hz frequency.
This modeling is performed by mathematically disassembling the distorted waveform
into a collection of higher frequency waveforms.
–
1000
–
500
0
500
1000
t
)s
p
m
a(
t
ne
rr
u
C
a
2a
–
1500
1500


