Doc
#
E159708
B-16
B: Three-Phase Power Measurement
Electro
Industries/GaugeTech
™
Powered by Innovation™
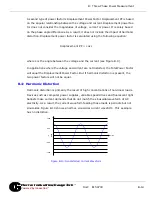
These higher frequency waveforms are referred to as harmonics. Figure B.12 shows
the content of the harmonic frequencies that make up the distortion portion of the
waveform in Figure B.11.
Figure B.12: Waveforms of the Harmonics
The waveforms shown in Figure B.12 are not smoothed but do provide an indication of
the impact of combining multiple harmonic frequencies together.
When harmonics are present it is important to remember that these quantities are
operating at higher frequencies. Therefore, they do not always respond in the same
manner as 60 Hz values.
Inductive and capacitive impedance are present in all power systems. We are accus-
tomed to thinking about these impedances as they perform at 60 Hz. However, these
impedances are subject to frequency variation.
X
L
= jwL and
X
C
= 1/jwC
At 60 Hz, w = 377; but at 300 Hz (5th harmonic) w = 1,885. As frequency changes
impedance changes and system impedance characteristics that are normal at 60 Hz
may behave entirely differently in the presence of higher order harmonic waveforms.
Time
Amps
3rd harmonic
5th harmonic
7th harmonic
Total
fundamental
– 500
0
500
1000

