D-0123672-H – 2022/05
Affinity Compact - Instructions for Use - US
Page
39
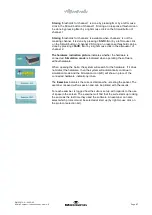
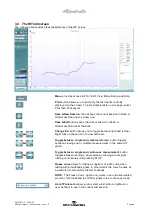
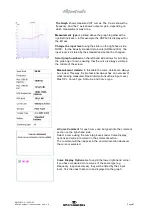
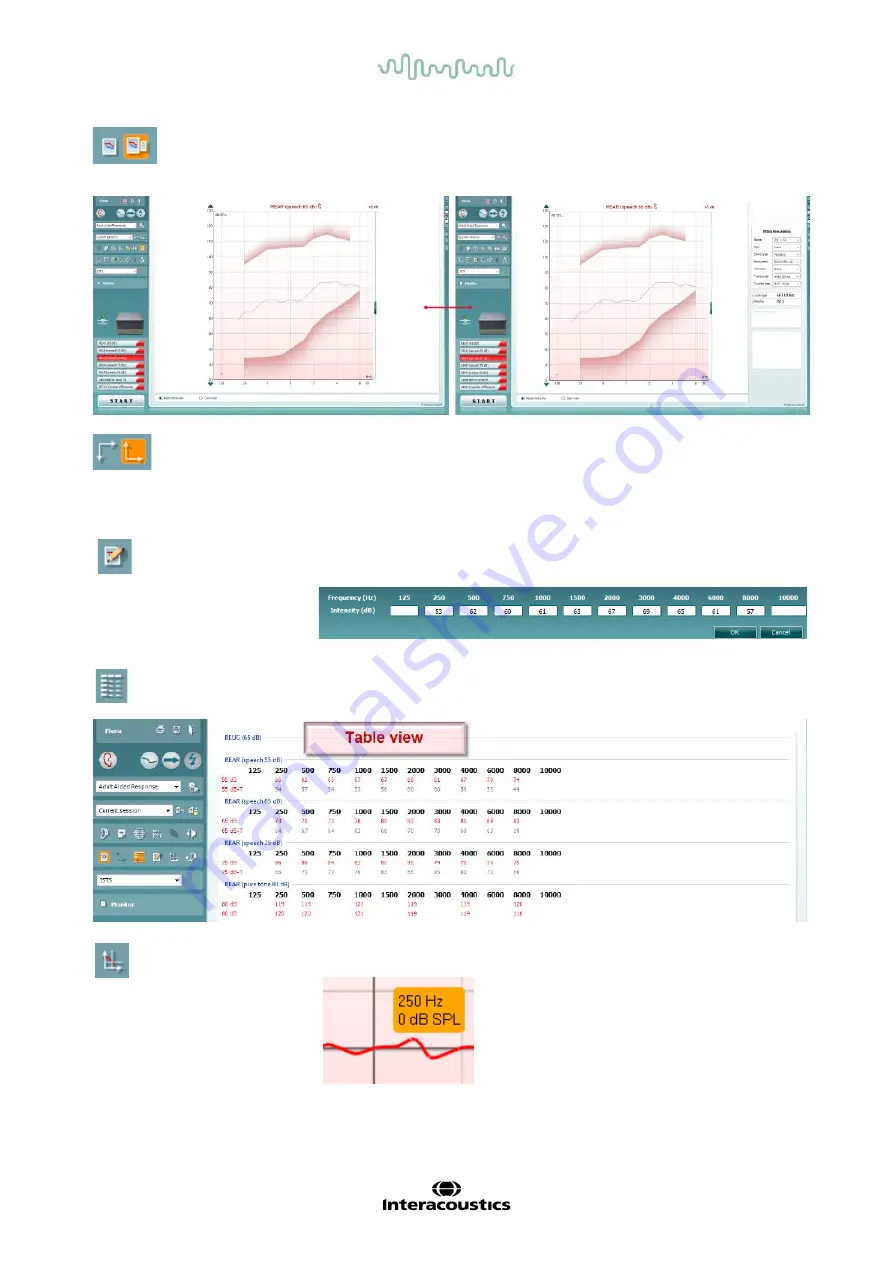
Table View
button provides a chart view of the measured and target
values.
Show Cursor on Graph
locks the cursor to the curve, displaying the
frequency and intensity at any given point along the measure curve.
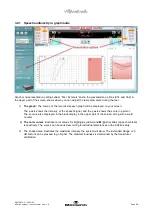
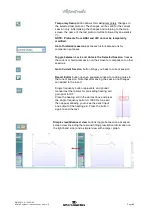
Simple View/Advanced View
buttons toggle between an advanced
screen view (including the test and fitting prescription information on the
right-hand side) and a more simple view with a larger graph only.
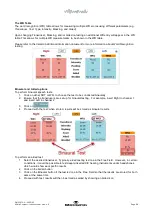
Normal and Reversed Coordinate System
buttons enable you to
toggle between reversed and normal graph displays.
This may be helpful for counselling purposes since the reversed view
look more like the audiogram and may therefore be easier for the client
to comprehend when explaining his/her results.
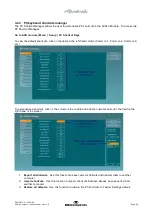
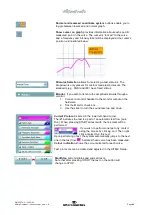
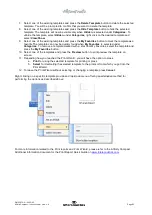
Insert/Edit Target
button allows you to type in an individual target or
edit an existing one. Press the button and insert the preferred target
values in the table as illustrated below. When satisfied click
OK.


