4
RECORDING MANAGEMENT
4
RECORDING MANAGEMENT
4.2 Recordings
4.2 Recordings
Use the arrows in the label bar above the time axis to navigate in the recording history. Use the left-hand arrow
for switching to the previous time period, the right-hand arrow for moving on to the next one and the up arrow
to lengthen the displayed period (from an hour to a day, etc.). You can also click one of the bars to display a
detailed list of events that have occurred in the particular time period.
A green triangle acting as a play button is displayed beneath the bars that contain video. By clicking it, the
given video content is played in the player window on the right from the graphs.
The player controls are quite intuitive buttons similar to the ones found on most applications of this type (Figure
26).
Figure 26: From left: previous video, rewind, previous picture, pause, next picture, play, next video, speed of recording
menu
Holding the mouse cursor over a button will display a legend with its function.
As with the live view function, you can enlarge a part of the viewed video and/or switch it into full-screen mode
(for the description of how to do it, see the chapter 4.1 Live View).
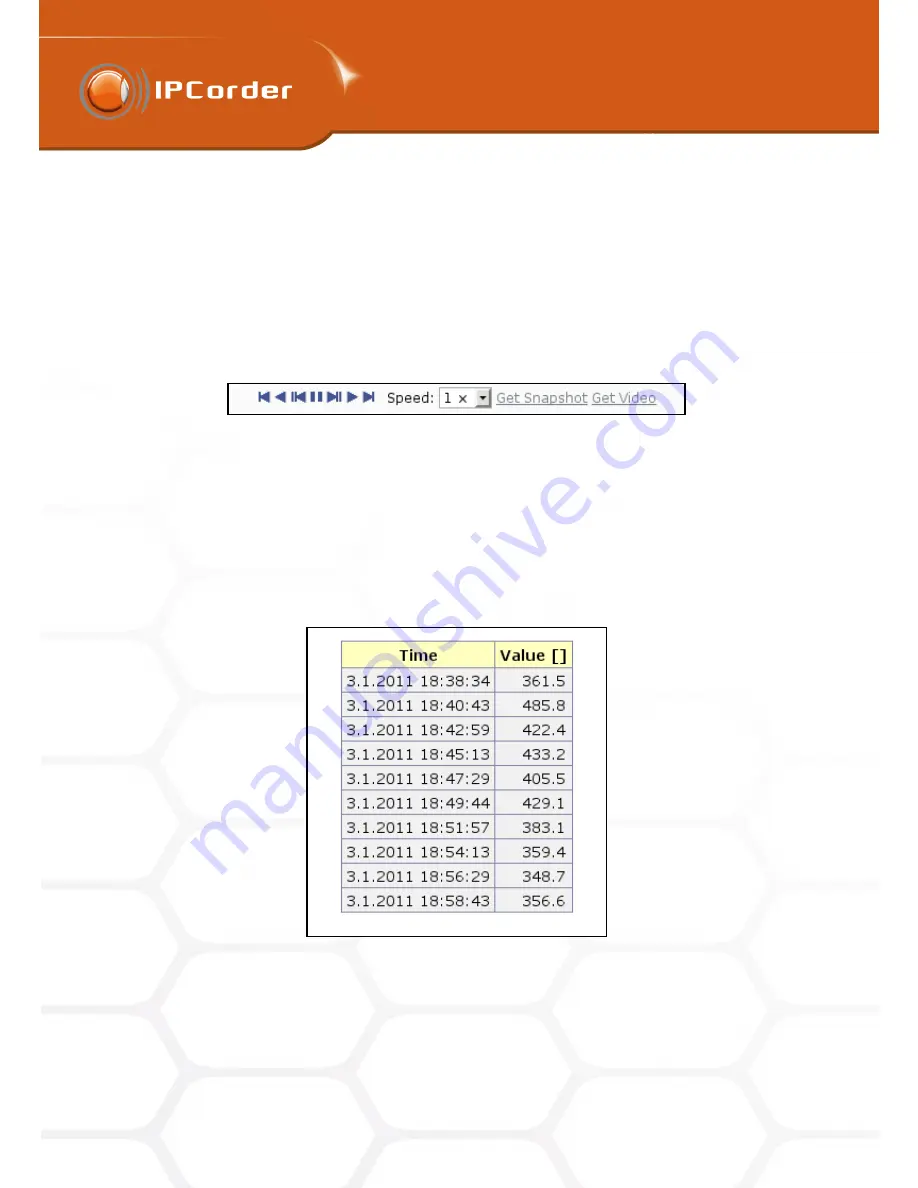
Beneath the time intervals that contain values from sensors, a grey rectangle is displayed. Clicking it opens a
new window that lists the values returned in the given time period (Figure 27). Your browser’s settings must
allow opening of pop-up windows.
Figure 27: Displaying values returned by a sensor
Only a limited number of values can be displayed in the window (maximum 200 items). In case the given time
period contains too many values, simply shorten the time period to a one step shorter unit (for example from a
week to a day).
35
Summary of Contents for KNR-090 4
Page 1: ......
Page 2: ...IPCorder User Manual 1 4 Copyright c KOUKAAM a s 2011...


