5-4
5.3
SEA
CLUTTERS
In addition to the echo required for observing ships and land radar video image also includes unnecessary echo,
such as reflection from waves on the sea surface and reflection from rain and snow. Reflection from the sea
surface is called "sea clutter," and reflection from rain and snow is called "rain and snow clutter," and those
spurious waves must be eliminated by the clutter rejection function.
[I] Sea
clutter
Sea clutter appears as an image radiating outwardly from the center of the radar display and changing
depending on the size and the shape of waves. Generally, as waves become larger, image level of the sea
clutter is intensified and the clutter far away is also displayed. When waves are large and the sea clutter
level is high, it is difficult to distinguish sea clutter from a small boat whose reflection intensity is weak.
Accordingly, it is necessary to properly adjust the sea clutter rejection function. Table 5.1 shows the
relation between the sea state (SS) showing the size of waves generated by wind and the radar's detection
probability.
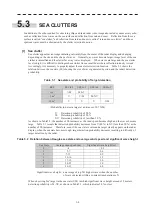
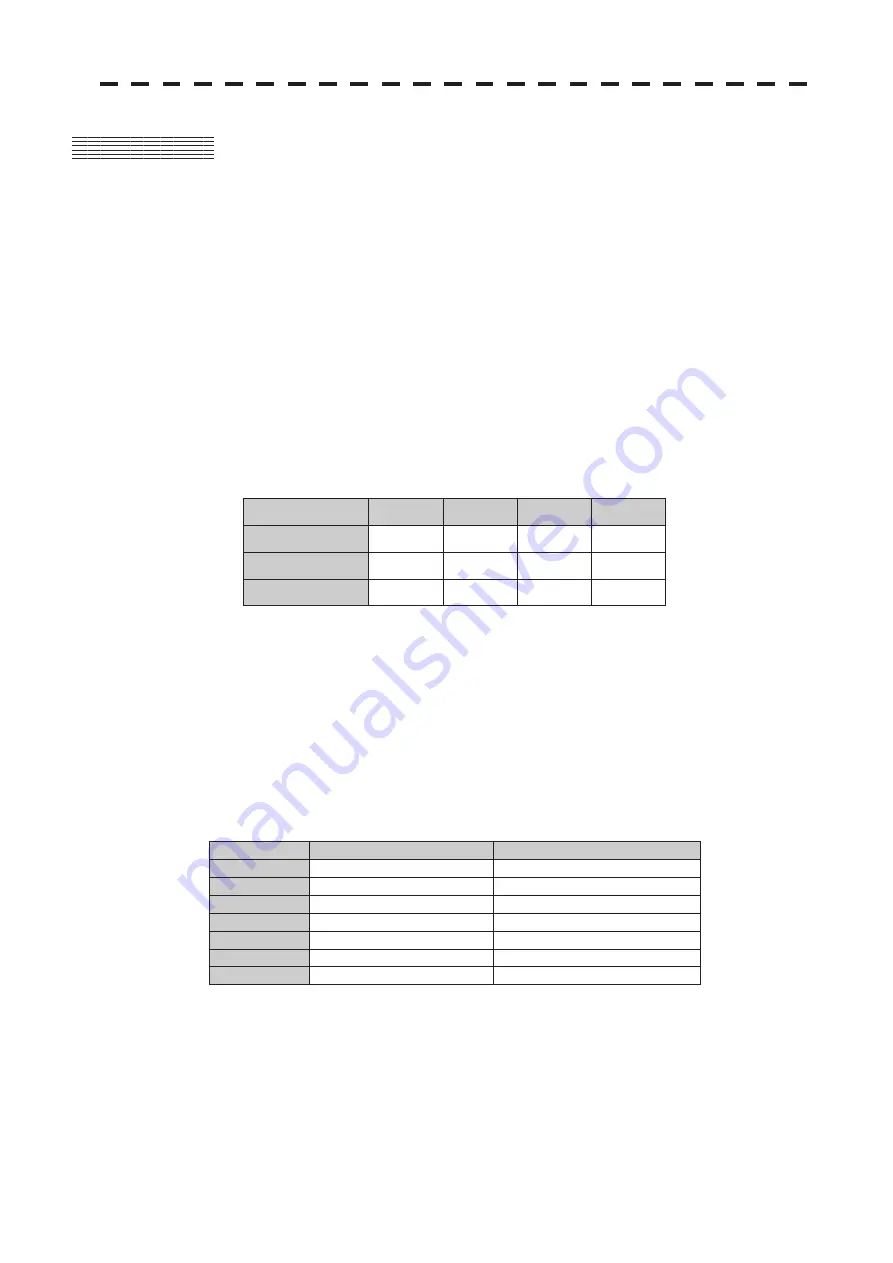
Table 5.1 Sea state and probability of target detection
(Probability to detect a target at a distance of 0.7 NM)
V:
Detection probability of 80 %
M: Detection probability of 50 %
NV: Detection probability of less than 50 %
As shown in Table5.2, the number of SS increases as the wind speed becomes high and the waves become
large. Table 5.1 reveals that detection probability decreases from V (80 %) to NV (less than 50 %) as the
number of SS increases. Therefore, even if the sea state is calm and a target clearly appears on the radar
display, when the sea state becomes rough, target detection probability decreases resulting in difficulty of
target detection by the radar.
Table 5.2 Relation between Douglas sea state and average wind speed and significant wave height
Sea State
Average wind speed (kn)
Significant wave height (m)
0 <4
<0.2
1 5-7
0.6
2 7-11
0.9
3 12-16
1.2
4 17-19
2.0
5 20-25
3.0
6 26-33
4.0
Significant wave height: an average of top N/3 higher waves when the number
of waves detected within a constant time duration is N
When observing 5m
2
target in the sea state (SS3) in which significant wave height exceeds 1.2 meters,
detection probability is M-NV, as shown in Table5.1, which indicates 50 % or less.
RCS
SS1 to 2
SS2 to 3
SS3 to 4
SS4 to 5
1m
2
V-M
M-NV
5 m
2
V
V-M
M-NV
10 m
2
V
V
V
V-M
Summary of Contents for JMR-611
Page 2: ......
Page 24: ......
Page 26: ......
Page 28: ......
Page 33: ...1 5 1 1 4 EXTERIOR DRAWINGS y Fig 1 1 Exterior Drawing of Scanner Unit Type NKE 387 Unit mm...
Page 34: ...1 6 Fig 1 2 Exterior Drawing of Processing Unit Type NDC 1774 Unit mm...
Page 35: ...1 7 1 1 4 EXTERIOR DRAWINGS y Fig 1 3 Exterior Drawing of Operating Unit Type NCE 5923 Unit mm...
Page 38: ......
Page 54: ......
Page 116: ......
Page 118: ......
Page 124: ......
Page 134: ......
Page 136: ......
Page 142: ......
Page 144: ......
Page 154: ......
Page 156: ......
Page 160: ......
Page 164: ......
Page 166: ......
Page 172: ......
Page 174: ......
Page 177: ...APPENDIX Fig 1 Block Diagram of JMR 611...
Page 181: ...APPENDIX Fig 5 Internal Connection Diagram of Control Unit NCM 994...
Page 182: ......
Page 184: ......
Page 186: ......
Page 187: ......

