14
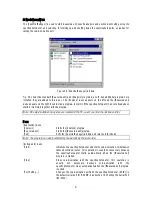
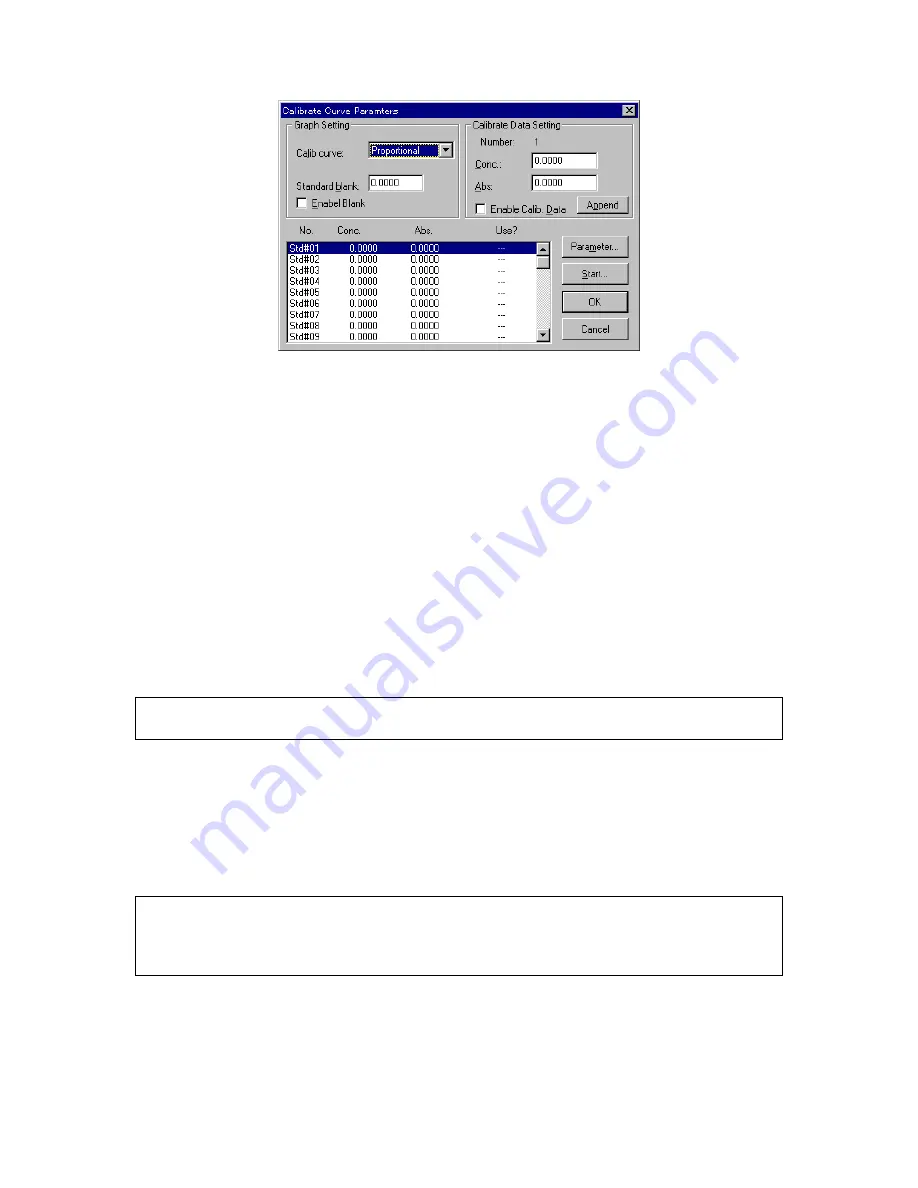
F igure 3.6 [C alibrate C urve P aram eters] dialog box
(5) C alibration curve param eter setting
1)
S et [C alib. curve] to [P roportional]. U se the sam e procedure as for changing param eters
2)
If [S tandard blank] is know n, input that value to the text box. If the [S tandard blank] is
unknow n, it w ill be m easured later. In that case, steps 2) and 3) are not necessary.
3)
S elect the [E nable B lank] checkbox. T he checkbox is m arked w ith an [x].
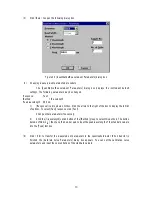
(6) Inputting concentration
1)
C lick the [S td#01] line of the standard data display field. T he cursor m oves to that line.
2)
Input concentration to the [C onc.] text box of the [C alibrate D ata S etting] group. C lick
<A ppend>. T he concentration appears in the standard data display field and the cursor m oves to the
next line autom atically.
N ote: If the absorbance of the standard sam ple is know n, m easuring the standard sam ple is not necessary.
Input the absorbance, then select the [E nable C alib. D ata] checkbox. C lick <A ppend>.
3)
R epeat step 2) as m any tim es as the num ber of standard sam ples.
4)
C lick the [S td#01] line in the data display field. T he cursor returns to line 1.
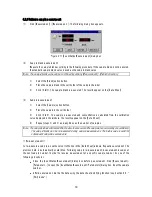
(7) C lick <S tart...>. T he [Q uantitative M easurem ent] dialog box opens. T he standard blank and standard
sam ples are m easured.
N ote: The [Q uantitative M easurem ent] dialog box appears on top of the [C alibrate C urve P aram eters] dialog
box. To view the [C alibrate C urve P aram eters] dialog box, click and drag the title bar of the [Q uantitative
M easurem ent] dialog box. B oth dialog boxes are active. The calibration curve param eters can be
changed according to steps (5) and (6).


