44
4.4 [E dit] m enu
4.4.1 [C opy P icture]
C opies a calibration curve to the clipboard as a picture.
4.4.2 [C opy B itm ap]
C opies a calibration curve to the clipboard as a bitm ap. S uitable for editing graphs using paint-type
softw are such as P aintbrush.
4.4.3 [C opy T ext]
C opies the results of quantitative analysis to the clipboard in a text form at.
4.4.4 [Invalid]
Invalidates selected lines from the D ata S heet. T he line appears gray and is not printed. T o validate the line
again, select it, then click [Invalid] again.
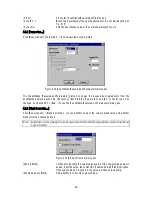
4.4.5 [D ata Input...]
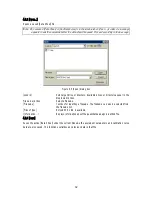
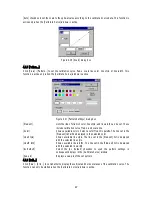
C lick [E dit] - [D ata Input...] to input m easurem ent data directly using the num ber keys. S elect a cell from the
[D ata S heet]. T he follow ing dialog box appears. If absorbance data is input, the concentration is calculated
according to the current quantitative analysis m ethod and is w ritten to the concentration field.
T he [D ata Input] dialog box can also be opened by double-clicking a cell.
F igure 4.24 [D ata Input] dialog box
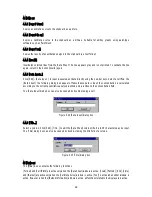
4.4.6 [T itle...]
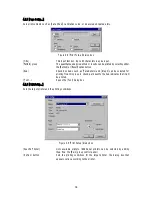
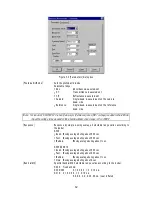
S elect a colum n. C lick [E dit] - [T itle...] to edit the [D ata S heet] colum n title. U p to 30 characters m ay be input.
T he [T itle] dialog box can also be opened by double-clicking the title field of a colum n.
F igure 4.25 [T itle] dialog box
4.5 [View ] m enu
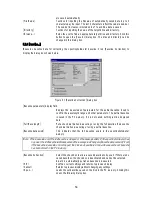
T he [V iew ] m enu contains the follow ing functions.
[Form at] and [C ell W idth] are active only w hen the [D ata S heet] w indow is active. [S cale], [P attern], [G rid], [S tyle],
and [M arker] are active only w hen the [C alibrate C urve] w indow is active. [Font] is active w hen either w indow is
active. H ow ever, w hen the [M ethod Inform ation] w indow is active, all functions related to the display are inactive.


