73
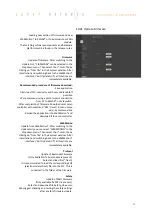
Process of a Frequency Analysis:
This process shows a typical process of a frequency
analysis:
Notes to frequency analysis:
•
The filter frequency might not always be able to clear
the oscillation. Especially when the resonance frequency
is low, the controller can possibly be affected too much
by the filter frequency
and the oscillation won’t
disappear. In this case please reduce GAIN POS until the
oscillation disappears.
•
If there are multiple resonance frequencies, try to put
the filter frequency in the approximate middle of the
resonance frequency.
•
On frequency 0, the mean current will be displayed
during the frequency analysis. It corresponds to the DC-
portion of the motor current, which is rarely 0.
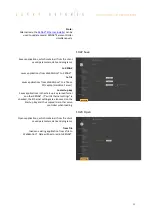
Diagram Amplitude
In this diagram, the amplitudes of all existing
frequencies in the motor current are shown. The
amplitude and the frequency of the cursor position
are displayed on the left side of the diagram.
Diagram I-Motor
This diagram displays the motor current for the
frequency analysis. The motor current and the
recording time at the cursor position are displayed on
the left side of the diagram. Furthermore the same
legend shows the position the linear motor slide was
located, at the time of the recording.


