background image

SEM manual ETHZ v1.4


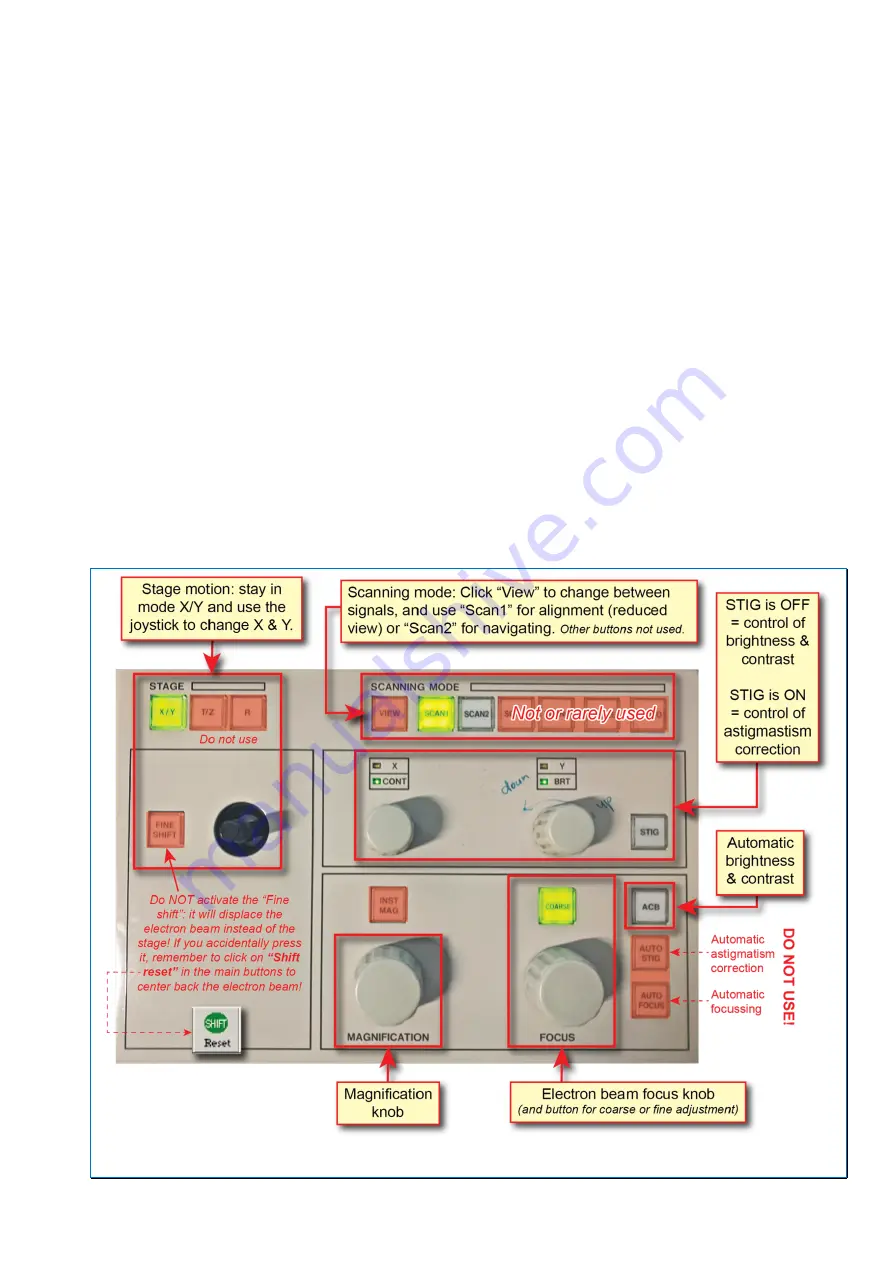
A.4) Overview of the JEOL console 

The  JEOL  SEM  has  a 

console 

that  is  used  to  control  the  stage  motion  (X,  Y),  and  the 

electron imaging capabilities (magnification, brightness & contrast, etc.; 

Fig. 3

):


The left side

 of the console controls the stage motion. 

Leave the “Stage” setting 

to “X/Y”!

 You can then use the joystick to move along the X and/or Y axis. 


The  top-right  side

  of  the  console  “Scanning  mode”  has  several  options  for  the 

different scanning rate. You will most likely use only 

“Scan2”

 (full-frame fast scan, 

ideal for navigating in the sample) or 

“Scan1”

 during the alignment (fast scan over a 

reduced area). Other scanning options (Scan3 or 4, Photo) are not recommended; 
Thermo NSS (

Section H

) is used for acquiring and saving high-quality images. 


The  middle-right  side 

controls  either  the  brightness  and  contrast  (when  STIG  is 

OFF) or the astigmatism correction (when STIG is ON). In any case, prefer the use 
of the buttons atop of the electron image to adjust these parameters. 


The bottom side

 of the console has 2 similar knobs for magnification (left) and focus 

(right). 

Pay attention to which one you twist!


o


Left-one

  is  the 

MAGNIFICATION  knob

.  It  controls  the  field  of  view  of  the 

electron image, from 20-40x to 300,000x. 

o


Right-one

 is the 

ELECTRON BEAM FOCUS knob

. It controls the focus point 

of  the  electron  beam  through  the  objective  lens  and  defines  the 

working 

distance  (WD)

.  Activate  the  “coarse”  button  for  large  changes  in  the  focus 

(e.g., rough focussing), and DE-activate this “coarse” button for fine tuning. 


Figure 3. Overview of the SEM console. 

Summary of Contents for JSM-6390 LA

Page 1: ...Scanning Electron Microscope SEM JEOL JSM 6390 LA User s manual Julien M Allaz March 14 2021 Version 1 4...

Page 2: ......

Page 3: ...3 D 2 Vertical displacement Z 13 D 3 Rotation R 13 D 4 Tilting T 13 E Activate the electron beam 15 E 1 Activating a LaB6 electron source in LaB6 mode 15 E 2 Activating a W electron source in LaB6 mod...

Page 4: ...Spectrum 43 J 5 3 Exporting a Point Shoot analysis 43 K EDS element mapping 45 K 1 Acquiring an element map with the mode Spectral Imaging 45 K 2 Treating element or phase maps 47 K 2 1 Extracting El...

Page 5: ...D ERDW IGP has SE secondary electron BSE backscattered electron and CL cathodoluminescence imaging capabilities and can provide accurate standard based quantitative analyses of major and some minor e...

Page 6: ...1 Turn ON both computer screens 2 Check the general status of the instrument o Is it working and under high vacuum Check the vacuum controller box on wheel on the LEFT side of the instrument with ind...

Page 7: ...ended Thermo NSS Section H is used for acquiring and saving high quality images The middle right side controls either the brightness and contrast when STIG is OFF or the astigmatism correction when ST...

Page 8: ...ction electron image display with grey buttons used to control the image quality and on the right side a snapshot image of the sample holder Bottom section instrument status voltage WD spot size etc F...

Page 9: ...SEM manual ETHZ v1 4 5 Figure 5 Overview of the main buttons in the TOP section of the SEM program...

Page 10: ...6 J M Allaz March 14 2021 Figure 6 Overview of the MIDDLE section of the SEM program Figure 7 Overview of the BOTTOM section of the SEM program...

Page 11: ...user and see if you can wait for the completion or if you can cancel the analysis 4 Turn ON the infrared camera Deben small screen on the left Fig 8 Figure 8 Main SEM detectors and components visible...

Page 12: ...8 J M Allaz March 14 2021 Figure 9 Preparing the sample holder for thin section or for 1 round mount...

Page 13: ...NOT apply if the SEM is in W mode see Appendix A2 8 When fully vented open the sample chamber see C 2 and Figure 11 C 2 Removing Loading a sample closing the chamber 1 Open the sample chamber up to th...

Page 14: ...10 J M Allaz March 14 2021 Figure 10 Opening the sample chamber to remove or place a sample...

Page 15: ...SEM manual ETHZ v1 4 11 Figure 11a Loading a new sample and taking an overview image of your sample SNS...

Page 16: ...12 J M Allaz March 14 2021 Figure 11b Evacuating pumping the sample chamber after un loading a sample...

Page 17: ...to ensure that the stage does not bump into the BSE or the CL detector Repairs can be costly To move the sample up or down along the Z axis Open the window Stage and two options Safest Use the cross s...

Page 18: ...14 J M Allaz March 14 2021 Page left blank intentionally a good place for your notes J...

Page 19: ...usually left in standby condition the filament heat is just enough to keep the filament warm but not enough to emit electron You ll need to perform a filament saturation by setting the filament heat...

Page 20: ...March 14 2021 Figure 12 Activation of the electron beam in LaB6 mode Two different processes depending on the electron source currently used LaB6 cathode or W filament Refer to Appendix A2 if the SEM...

Page 21: ...e of the TILT until the beam current is maximised repeat for the Y value of the TILT 5 Increase the current Spotsize 90 and adjust the SHIFT X Y values 6 Set back a low beam current e g spotsize 50 or...

Page 22: ...al part of the sample holder increase the magnification to 100 or 200x so you don t see the edge of the CL detector anymore 6 Locate a small particle or some marks intersecting at 90 7 Adjust the brig...

Page 23: ...SEM manual ETHZ v1 4 19 Figure 13 Complete procedure for beam alignment...

Page 24: ...2021 Figure 14 Detail on the adjustment of the Z stage position for quantitative analysis and SE BSE imaging optimum Z 10 to 11 mm at a fixed Working Distance WD 10 mm versus cathodoluminescence imag...

Page 25: ...SEM manual ETHZ v1 4 21 Figure 15 Detail on the beam alignment procedure to obtain the best image quality...

Page 26: ...ation of brightness contrast Constantly adjust B C to reveal what you need to see Avoid under black or over saturated white areas unless a high contrast is required to reveal a small signal variation...

Page 27: ...tector G 1 Inserting or removing the CL detector WARNING Whenever you insert or remove the CL detector ensure that the Z stage position is at 30 mm Figure 17a Inserting or removing the CL detector WAR...

Page 28: ...Sections H To acquire a single or mosaic image follow the instructions given in Sections I WARNING If the OVERLOAD button turns ON Fig 17b it means that the detector is saturated with light Either you...

Page 29: ...ommended to create a NEW project folder per analytical session1 o Select your user data folder E LastName FirstName If a folder with your last name and first name does not exist In Project Explorer se...

Page 30: ...26 J M Allaz March 14 2021 Figure 18 Creating a new NSS project or opening an existing one...

Page 31: ...gram NSS consists of several panels described in Figure 19 The present manual only covers the essential functionalities of the modes Electron Imaging Spectrum Point Shoot or Spectral Imaging hyperspec...

Page 32: ...28 J M Allaz March 14 2021 Page left blank intentionally a good place for your notes J...

Page 33: ...ication to the desired field of view Avoid low magnification 100x as you will have edge effects shadow deformation Adjust the Z stage position for SE BSE images at fixed WD or the focus for CL images...

Page 34: ...30 J M Allaz March 14 2021 Figure 20 Electron Imaging mode acquire a single image in Thermo NSS...

Page 35: ...under the Stage Movement b Click on the button to add a new grid It opens a frame with options i Enter a name for this grid The final name of each image of the mosaic will be Base Name Grid Name 0 0...

Page 36: ...32 J M Allaz March 14 2021 Figure 21 Electron Imaging mode acquire a mosaic image in Thermo NSS...

Page 37: ...al image i e consider the true pixel size in micrometre Check the Appendix A4 for determining the pixel size of your individual image of the mosaic Do not choose a too high magnification that would re...

Page 38: ...34 J M Allaz March 14 2021 Page left blank intentionally a good place for your notes J...

Page 39: ...WD 9 700 at 15 keV or 9 800 at 20 keV Figure 22 SEM EDS information found at the footnote of the NSS program acceleration voltage ACC magnification MAG working distance WD last beam current measuremen...

Page 40: ...red at the same VOLTAGE as your analyses usually 15 kV If multiple standards are available such as Fe2O3 and FeS2 for Fe at the same kV choose the one the most similar to the type of phase to be analy...

Page 41: ...SEM manual ETHZ v1 4 37 Figure 23 Loading standards into your project for quantitative EDS analysis...

Page 42: ...ure the last checkbox Measure beam current is checked f Click OK 3 Move the stage in position for the analysis fine tune the Z stage position and increase the magnification usually 1000x to scan only...

Page 43: ...SEM manual ETHZ v1 4 39 Figure 24 Spectrum Acquiring a single EDS spectrum over the currently scanned area...

Page 44: ...ctangle an area with similar intensity a circle or a polygon Use a single click for point click and drag for rectangle and circle and left click for each corner of a polygon right click to close the p...

Page 45: ...SEM manual ETHZ v1 4 41 Figure 25 Point Shoot Acquiring multiple EDS analyses selected on an electron image...

Page 46: ...efault it assumes that each element is an oxide and it will force the recalculation of oxygen by stoichiometry If you analyse sulphide metal or other non oxide you should deactivate this checkbox J 4...

Page 47: ...ight Number of Cations Atomic proportion from the oxygen normalisation Standard Name Name of the standard file used can be useful for your record On the top right part of the Properties window you can...

Page 48: ...44 J M Allaz March 14 2021 Page left blank intentionally a good place for your notes J...

Page 49: ...aging EDS and Spectral Imaging a Tab Imaging The spectral imaging needs a base BSE or SE image Set the resolution for this BSE image e g 1024x768 pixels 2 frames 10 s each b Tab EDS You only need to s...

Page 50: ...you can add or remove identified elements using the periodic table in the tab Element Setup on the bottom left panel and request to reprocess the data to extract more elements see more in Section K 2...

Page 51: ...tional options once the maps are extracted K 2 2 Extracting Phase maps To extract phase maps see Fig 28 1 Activate first the COMPASS mode and choose either a Components to show the principal component...

Page 52: ...48 J M Allaz March 14 2021 Figure 27 Processing and extracting element maps...

Page 53: ...SEM manual ETHZ v1 4 49 Figure 28 Calculating and extracting phase maps...

Page 54: ...that this option will likely include pixels from other phases surrounding the phase of interest Double click on the name of a phase to rename it once you have properly identified it Use the spectrum e...

Page 55: ...ired if the sample is not centred yellow line NOT in the middle of the stage holder To perform the adjustment see also Fig A1 o Press the button Adjust Ensure the Holder Size 32 mm is selected o Adjus...

Page 56: ...with SNS as usual Then lower the stage to 30 mm Close the sample chamber keep an eye on the IR camera Press the button EVAC to pump Wait for the signal READY The HT button should now be blue Press on...

Page 57: ...SEM manual ETHZ v1 4 53 Figure A2 Saturation of the W filament in W mode When the optimum is reached the emission current should read 30 to 50 A or higher...

Page 58: ...eristic X ray Figure A3 All common electron transitions and characteristic X ray generation From Goldstein et al 2003 Scanning Electron Microscopy and X Ray Microanalysis Fig 6 9 p 280 Original in Wol...

Page 59: ...2 x 40 sec instead of the regular 2 x 10 sec For EDS element mapping consider smaller images e g 256 x 192 px and select an image resolution and magnification such that the pixel size is equal or lar...

Page 60: ...in plagioclase In this case you should certainly first discuss with the lab manager Use Figures A5 1 and A5 2 as a reference to define the minimum counting time per frame to reach the desired quality...

Page 61: ...SEM manual ETHZ v1 4 57 Figure A5 2 Relationships between magnification map pixel size and counting time Use these plots to estimate the best analytical conditions for your needs...

Page 62: ...58 J M Allaz March 14 2021 A6 Thermo NSS toolbars from the NSS manual...

Page 63: ...ral image SI binary file Compressed binary data of the spectral image SIREF TIF file Raw BSE or SE image at the full resolution without scale bar A7 4 Export files generated by Thermo TIF TIF file Exp...

Page 64: ...scale phase maps Morphology operation to account for overlapping excitation volumes User adjustable image output Ratio of two compounds in a single phase e g Ca Na in plagioclase And more Figure A8 Ex...

Page 65: ...repolish it to remove the coating and re coat it with 20 nm carbon Ask for assistance if necessary Are you analysing beam sensitive material e g hydrated phase Na or K rich phase carbonate phosphate...

Page 66: ...e itself Try again It should now work In imaging mode SE BSE CL you might sometime see a shadow on one corner or on one edge of the image This is most likely due to a very bad alignment of the beam ap...

Page 67: ...orm the reset of the Thermo NSS box as described below 1 Select the acquisition mode Spectrum in the left menu 2 Open the tab Detector Status on the bottom right panel 3 Click on Advanced Status It la...

Page 68: ...usser and inspiration taken from the original 7 page SEM manual from Dr Lukas Martin Many thanks to them Comments suggestions questions about this manual Contact Julien M Allaz julien allaz erdw ethz...

Reviews: