10 ©
Copyright 2017 Advanced Computer & Network Corp. All Right Reserved.
.
2.2.4.
Dashboard
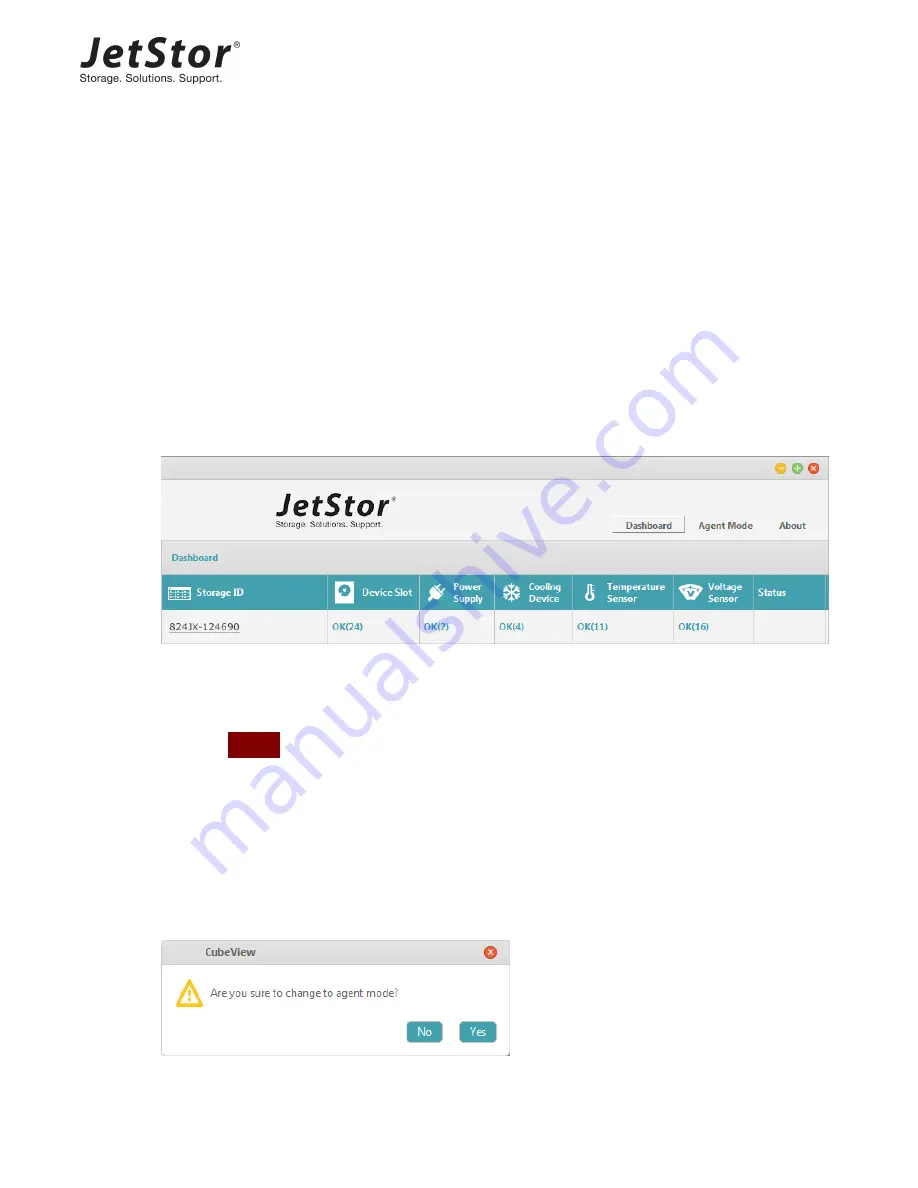
When users click the
Dashboard
button on the top right corner, the main working area will
show the status summary of all managed devices. Dashboard information includes the
following items.
Storage ID
Device Slots
Power Supply
Cooling Device
Temperature Sensor
Voltage Sensor
Status
Figure 2-9
Dashboard Information
The status shows OK if the items are fine. If the items have problem, it will show fault
indicator _
Fault
_. The numbers in brackets are the total quantity of the items.
2.2.5.
Agent Mode
When users click the
Agent Mode
button on the top right corner, the CubeView can switch
to the agent mode.


