JPK Instruments NanoWizard
®
Handbook Version 2.2a
13
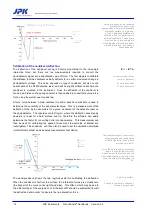
Once the tip is in contact with the sample, it remains on the surface as the
separation between the base and the sample decreases further, causing a
deflection of the tip and an increase in the repulsive contact force. As the cantilever
is retracted from the surface, often the tip remains in contact with the surface due to
some adhesion and the cantilever is deflected downwards. At some point the force
from the cantilever will be enough to overcome the adhesion, and the tip will break
free.
More complex interactions
Many interesting samples are not hard and incompressible, and a more general pair
of approach and retract curves will include sample compression, hysteresis and
more complex adhesion between the tip and surface. In liquid, there may not be an
obvious snap to contact in the approach curves even over a hard surface such as
mica. Over a soft, compressible sample in liquid, the force curve often shows a
gradual increase in force, without the sharp onset of the interactions seen in air. It
is often difficult to define a single point where the tip and sample come into
“contact”, since the initial compression of the surface causes very little deflection of
the cantilever.
The gradient of the repulsive contact region changes as the sample is indented and
the apparent stiffness may change as the structure is compressed. For thin
samples on a hard surface, the linear repulsive contact regime may be seen at
large deflections, as the tip may indent the sample enough to feel the supporting
surface below. The contact area will change as the tip indents a soft surface, so
the actual interactions involved in compression can be hard to quantify, and
different points within the region will experience different levels of compression.
When the tip is retracted from the surface, there is often a hysteresis seen, if the
sample is not perfectly elastic, and many different adhesion responses can be
observed. In some cases, the cantilever pulls the tip free in stages, such as when
there are long molecules in the sample or on the tip. Extendable contacts are made
between the tip and sample, so that as the base of the cantilever retracts, the tip is
deflected down towards the sample until the force is strong enough to break the
contacts. Different molecules or parts of the sample may adhere and each part
may be broken separately, or together. These situations produce a variety of
adhesion events, and successive force curves can show very different responses.
The force curves are often repeated at different locations to build up a map of the
tip-surface interaction, or repeated many times at the same point to give a full
statistical understanding of the interaction.
3.2 Data processing for analysis
The most direct way to plot the data shows the movement of the piezo during the
force curve (as a distance) against the deflection of the cantilever. The deflection is
measured by an optical beam deflection setup which delivers an electrical signal (in
Volts, as the signal from the photodiode) that is proportional to the cantilever
deflection. In the example below, Approach (red) and retract (blue) curves are both
plotted on the same axes.

