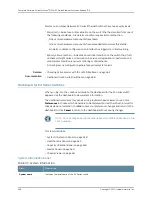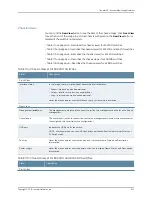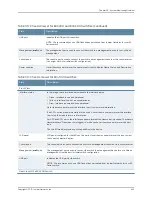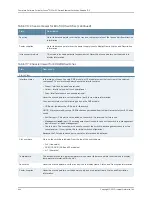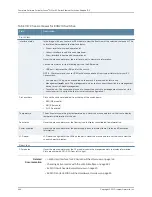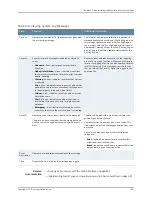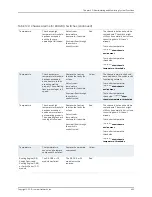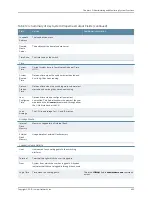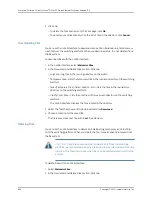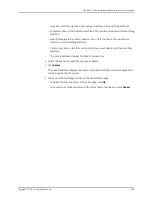
Table 119: Filtering System Log Messages
(continued)
Your Action
Function
Field
To specify events generated by a
process, type the name of the process.
For example, type
mgd
to list all
messages generated by the
management process.
Specifies the name of the process generating the events you want to
display.
To view all the processes running on your system, enter the CLI
command
show system processes
.
For more information about processes, see the
Junos OS Installation
and Upgrade Guide
at
http://www.juniper.net/techpubs/software/junos/index.html
.
Process
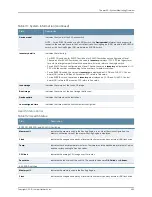
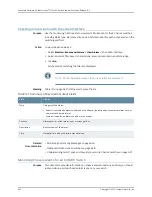
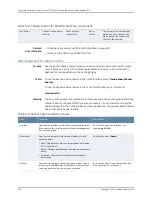
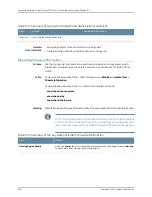
To specify the time period:
•
Click the
Calendar
icon and select the
year, month, and date—for example,
02/10/2007
.
•
Click the
Calendar
icon and select the
year, month, and date—for example,
02/10/2007
.
•
Click to select the time in hours,
minutes, and seconds.
Specifies the time period in which the events you want displayed are
generated.
Displays a calendar that allows you to select the year, month, day,
and time. It also allows you to select the local time.
By default, the messages generated in the last hour are displayed.
End Time shows the current time and Start Time shows the time one
hour before End Time.
Date From
To
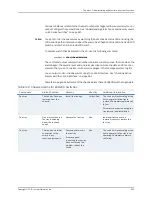
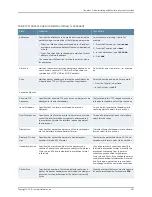
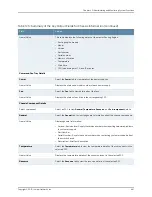
To specify events with a specific ID, type
the partial or complete ID—for example,
TFTPD_AF_ERR
.
Specifies the event ID for which you want to display the messages.
Allows you to type part of the ID and completes the remainder
automatically.
An event ID, also known as a system log message code, uniquely
identifies a system log message. It begins with a prefix that indicates
the generating software process or library.
Event ID
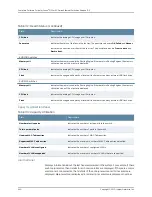
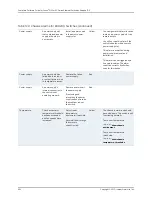
To specify events with a specific
description, type a text string from the
description with regular expression.
For example, type
^Initial*
to display all
messages with lines beginning with the
term
Initial
.
Specifies text from the description of events that you want to display.
Allows you to use regular expressions to match text from the event
description.
NOTE: Regular expression matching is case-sensitive.
Description
To apply the filter and display messages,
click
Search
.
Applies the specified filter and displays the matching messages.
Search
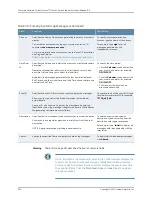
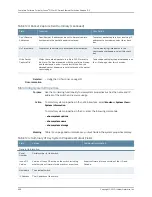
Meaning
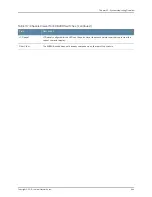
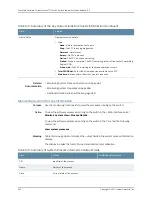
Table 120 on page 651 describes the Event Summary fields.
NOTE:
By default, the View Events page in the J-Web interface displays the
most recent 25 events, with severity levels highlighted in different colors.
After you specify the filters, Event Summary displays the events matching
the specified filters. Click the First, Next, Prev, and Last links to navigate
through messages.
Copyright © 2010, Juniper Networks, Inc.
650
Complete Software Guide for Junos
®
OS for EX Series Ethernet Switches, Release 10.3
Summary of Contents for JUNOS OS 10.3 - SOFTWARE
Page 325: ...CHAPTER 17 Operational Mode Commands for System Setup 229 Copyright 2010 Juniper Networks Inc ...
Page 1323: ...CHAPTER 56 Operational Mode Commands for Interfaces 1227 Copyright 2010 Juniper Networks Inc ...
Page 2841: ...CHAPTER 86 Operational Commands for 802 1X 2745 Copyright 2010 Juniper Networks Inc ...
Page 3367: ...CHAPTER 113 Operational Mode Commands for CoS 3271 Copyright 2010 Juniper Networks Inc ...
Page 3435: ...CHAPTER 120 Operational Mode Commands for PoE 3339 Copyright 2010 Juniper Networks Inc ...
Page 3529: ...CHAPTER 126 Operational Mode Commands for MPLS 3433 Copyright 2010 Juniper Networks Inc ...


