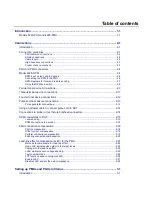
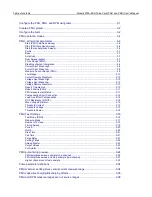
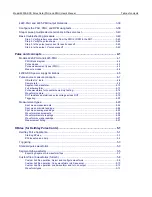
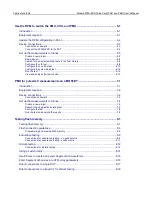
background image

User

's

 Manual

4200A-PMU-900-01 Rev. A December 2020

*P4200A-PMU-900-01A*

4200A-PMU-900-01A

    tek.com/keithley

Model 4200A-SCS

Pulse Card (PGU and PMU)

Summary of Contents for 4200A-SCS

Page 1: ...User s Manual 4200A PMU 900 01 Rev A December 2020 P4200A PMU 900 01A 4200A PMU 900 01A tek com keithley Model 4200A SCS Pulse Card PGU and PMU ...

Page 2: ...Pulse Card PGU and PMU User s Manual Model 4200A SCS ...

Page 3: ...y Instruments product names are trademarks or registered trademarks of Keithley Instruments LLC Other brand names are trademarks or registered trademarks of their respective holders Actuate Copyright 1993 2003 Actuate Corporation All Rights Reserved Microsoft Visual C Excel and Windows are either registered trademarks or trademarks of Microsoft Corporation in the United States and or other countri...

Page 4: ...ed to mains These instruments will be marked as category II or higher Unless explicitly allowed in the specifications operating manual and instrument labels do not connect any instrument to mains Exercise extreme caution when a shock hazard is present Lethal voltage may be present on cable connector jacks or test fixtures The American National Standards Institute ANSI states that a shock hazard ex...

Page 5: ...plains hazards that could damage the instrument Such damage may invalidate the warranty The CAUTION heading with the symbol in the user documentation explains hazards that could result in moderate or minor injury or damage the instrument Always read the associated information very carefully before performing the indicated procedure Damage to the instrument may invalidate the warranty Instrumentati...

Page 6: ... 13 Using an adapter cable to connect pulse card to DUT 2 14 Connections to prober or test fixture bulkhead connectors 2 14 RPM connections to DUT 2 15 Local sensing 2 15 RPM connections to a prober 2 16 PMU connection compensation 2 18 Short compensation 2 18 Offset current compensation 2 19 Perform connection compensation 2 19 Enabling connection compensation 2 20 Load line effect compensation L...

Page 7: ... 10 Report Status PMU 3 11 PMU measurement status 3 11 Compensation Short Connection 3 14 Load Line Effect Compensation 3 14 DUT Resistance R DUT 3 14 Max Voltage Estimator 3 15 Threshold Current 3 15 Threshold Voltage 3 15 Threshold Power 3 15 PMU Test Settings 3 16 Test Mode PMU 3 16 Measure Mode 3 17 Number of Pulses 3 19 Timing Sweep 3 19 Period 3 20 Width 3 20 Rise Time 3 21 Fall Time 3 21 Pu...

Page 8: ... Sample rate 4 9 Segment Arb waveform 4 10 Full arb waveform 4 13 Pulse waveforms for nonvolatile memory testing 4 14 Waveform capture 4 15 DUT resistance determines pulse voltage across DUT 4 15 Triggering 4 20 Measurement types 4 23 Spot mean measurements 4 24 Spot mean discrete readings 4 24 Spot mean average readings 4 25 Waveform measurements 4 25 Waveform discrete readings 4 26 Waveform aver...

Page 9: ...MOSFET 7 1 Introduction 7 1 Equipment required 7 2 Device connections 7 2 Connection schematic 7 3 Set up the measurements in Clarius 7 4 Create a new project 7 4 Search for and select an existing test 7 5 Configure the test 7 6 Run the test and analyze the results 7 8 Testing flash memory 8 1 Testing flash memory 8 1 Flash connection guidelines 8 3 Programming and erasing flash memory 8 3 Enduran...

Page 10: ...for the PMU it provides additional low current measurement ranges When the RPM is used as a switch it switches between the PMU SMUs and CVUs LPT functions that pertain to the PGU and PMU are documented in LPT commands for PGUs and PMUs in Model 4200A SCS LPT Library Programming To do quick tests with minimal interaction with other 4200A SCS test resources you can use the Keithley Pulse Application...

Page 11: ...Section 1 Introduction Model 4200A SCS Pulse Card PGU and PMU User s Manual 1 2 4200A PMU 900 01 Rev A December 2020 Figure 1 Simplified circuits of the PGU and PMU ...

Page 12: ...ot and oscillations You can use the Multi measurement Prober Cable Kits 4210 MMPC to connect the 4200A SCS to perform pulse I V measurements These kits help maximize signal fidelity by eliminating the measurement errors that often result from cabling errors The prober cable kits include 4210 MMPC C Multi Measurement I V C V Pulse Prober Cable Kit for Cascade Microtech 12000 prober series 4210 MMPC...

Page 13: ...he coaxial cabling Do not use the GNDU as common low for the PMU to avoid creating a large loop area When using the GNDU an inductive loop area is created when the HI and LO leads are separated Fast rise times dt high current di and large inductances L can cause voltage overshoots oscillations and ringing in the high speed measurement circuit This is based on Lenz s law V L di dt Shield connection...

Page 14: ...st 150 MHz Properly connect the shields of the coaxial cables and minimize the loop area of the shield connections see Shield connections on page 2 2 Minimize cable length see Cable length on page 2 3 Use a signal path that matches the impedance of the instrument 50 Ω The SMA cables supplied with the PMU and RPM are 50 Ω Prober chuck connections When possible avoid pulse connections to the prober ...

Page 15: ... connectors channel 1 or channel 2 on the 4225 PMU The RPM also has input connectors for a 4200 SMU or 4201 SMU source measure unit and a 4210 CVU or 4215 CVU capacitance voltage unit The following figure shows the modes for the RPM LED colors Note that the RPM LED shows the mode of the RPM but not the output status The output status of the 4200A SCS is indicated by the Operate light on the front ...

Page 16: ...diagram of the RPM is shown in the following figure Signals from the 4200A SCS instrument cards are routed through the RPM to the output Force and Sense connectors Switching is used to control which card is connected to the output See Using the RPM as a switch on page 2 8 for more information on switching The LEDs on the top panel see the previous figure indicate which card is connected to the out...

Page 17: ...sconnect the power cord before connecting or disconnecting the RPM to or from the PMU Failure to do so may result in RPM or PMU damage possibly voiding the warranty The RPM is matched to a PMU card and channel Make sure to connect the RPM only to that PMU card and channel With system power off use the supplied RPM cable to connect a 4225 RPM to the matching RPM channel of the 4225 PMU see followin...

Page 18: ...ing or removing an RPM always perform the Update the RPM configuration in Model 4200A SCS Setup and Maintenance procedure to ensure that KCon accurately represents the present 4200A SCS hardware configuration RPM diagrams for local and remote sensing The following figure shows the diagram for local sensing The center conductor of the Force triaxial connector is connected to the high side of the de...

Page 19: ...diagram on page 2 5 figure shows the switches The following figure shows a typical test configuration for using an RPM as a switch for a PMU SMU and CVU In general one RPM per device terminal is recommended By default the PMU with RPM is connected to the output unless a SMU or CVU is switched in Figure 9 Test configuration for using RPM as a switch Both the red cables supplied with the CVU and the...

Page 20: ...doing the steps in Update the RPM configuration UTM testing from within the user module use the LPT function rpm_config You must update the RPM configuration in KCon before using the RPM to control switching If you do not corrupt test data may result due to incorrect switch settings in the RPM Two terminal device connections The following figure shows connections to a two terminal device using a s...

Page 21: ...shown in the following figure In this case channel 1 will source pulse voltage and channel 2 will measure the resulting current Make sure you connect the shields of the SMA cables close to the device under test This method avoids problems of capacitive charging see PMU capacitive charging discharging effects on page 3 35 Figure 11 Two terminal device connections to a PMU using both channels ...

Page 22: ...of a single PMU connected to a three terminal MOSFET is shown in the following figure In this example connect the gate terminal to channel 1 of the PMU and connect the drain terminal to channel 2 Connect the source terminal to the outside shield of channel 2 Figure 12 Three terminal device connections to a PMU using both channels If ultra fast I V sourcing and measuring is required at each device ...

Page 23: ...lly required The following figure shows the four PMU channels connected to a four terminal MOSFET This configuration enables you to have complete flexibility to enable pulsing and measuring at any terminal on the device Notice that the shields of the SMA cables from all four channels are connected as closely as possible to the device under test Figure 13 Four terminal device connection to two PMUs...

Page 24: ...s To achieve optimum performance only use the cables connectors and adapters that are included with Keithley Instruments pulse source or measure kits For the pulse source measure configurations ensure the 4200A SCS high voltage is disabled This will prevent a safety hazard that could result in possible injury or death because of SMU voltages greater than 42 V being applied to the device under test...

Page 25: ... Adapter Cable 4200 PRB C included with the PGU and PMU The needle holders shown in the previous figure are supplied by the user Connections to prober or test fixture bulkhead connectors The 4200 PMU Prober Kit available from Keithley Instruments is a collection of standard and custom connectors and accessories used to connect the pulse generator to a common variety of probe stations This kit can ...

Page 26: ...corrupt data A device under test DUT can be tested using local sensing or remote sensing Local sensing is performed at the RPM while remote sensing is performed at the DUT When using remote sensing errors due to voltage drops in the Force path between the RPM and the DUT are eliminated With proper cabling SMU or CVU tests provide remote sensing through the RPM Local sensing For local sensing only ...

Page 27: ...are supplied by the user When using two RPMs for four terminal testing two Y cable assemblies are required Make sure to connect the two local grounds of the two cable assemblies together see following figure RPM connections to a prober Optional prober cable kits are available from Keithley Instruments These kits provide connections to a DUT Model 4210 MMPC S Use this cable kit with the Suss Micro ...

Page 28: ...he Suss prober PA 1001 for the Cascade prober PA 1080 for the Lucas Signatone prober and PA 1085 for the Wentworth prober Figure 18 RPM connections to a prober A Triax male to BNC female adapter supplied with the RPM B BNC male to SMA female adapter supplied with the RPM C White SMA cable 8 in 20 32 cm supplied with the RPM D SMA to SSMC Adapter Cable 4200 PRB C supplied with the PMU ...

Page 29: ...The custom values provide optimum compensation Custom connection compensation data is generated for offset current and short conditions The custom connection compensation values can be enabled or disabled from a test in Clarius If connection compensation is disabled the compensation values will not be applied to the measurements For optimum performance you should do connection compensation any tim...

Page 30: ...uces error currents by subtracting measurements taken at 0 V from all subsequent readings Perform connection compensation To compensate for connections 1 In Clarius select Tools The Clarius Tools dialog box opens Figure 19 Clarius Tools dialog box 2 Select PMU Connection Compensation The Short and Offset Current Connection Compensation Values and Defaults dialog box opens 3 From the PMU list selec...

Page 31: ...mpensation is complete If an error occurred it is displayed in the Clarius Messages area The compensation data is displayed in the Short and Offset Current Connection Compensation Values and Defaults dialog box If your test setup used both PMU channels you will have new custom data for both channels Enabling connection compensation This procedure is for ITMs For UTMs you need to enable connection ...

Page 32: ...tion Refer to the following figure Figure 21 Enabling connection compensation 7 Select OK 8 To disable connection compensation clear either Short Connection or Offset Current Correction then select OK When disabled connection compensation values are not applied to DUT measurements Load line effect compensation LLEC for the PMU Load line effect compensation LLEC is only performed for standard pulse...

Page 33: ...ry Programming Methods to compensate for load line effect The methods to compensate for load line effect include Use the built in load line effect compensation LLEC in the PMU for the standard 2 level pulse mode Ideally when LLEC is enabled the PMU adjusts its output levels such that the programmed output voltage appears at the DUT For ITMs see Load line effect compensation on page 2 21 For UTMs u...

Page 34: ...thod This method allows for range changing threshold comparison load line effect compensation and pulse timing This means there is separation between each set or burst of pulses The number of pulses output for each attempt is controlled by the Number of Pulses setting for ITMs or the pulse_meas_timing function for UTMs Note that LLEC is available only in the standard 2 level pulse mode LLEC is not...

Page 35: ...ecified The maximum number of iterations is reached The maximum number of iterations must be equal for each channel in the test Coping with the load line effect There are several ways of working with this effect The simplest one is to program the DUT load into the pulse card channel using the pulse_load function or setting the Pulse Load value in the KPulse on page 5 1 virtual front panel The puls...

Page 36: ...abled and the green curves were generated with LLEC disabled The Vg was been increased for the green curves to provide separation between the curves Figure 23 Load line effect on FET family of curves In the previous figure each blue curve LLEC on is the result of a sweep from 0 to 6 V using 250 mV steps Notice that the 24 pulse measure points are evenly spaced The same sweep is used to generate th...

Page 37: ...s Figure 24 Curve showing poor LLEC compensation LPT functions used to configure LLEC The LPT functions used to configure LLEC for the PMU are pulse_load Use this function to set the output impedance for the DUT when LLEC is disabled Setting the DUT resistance is useful when the DUT resistance is known and is relatively constant setmode Use this function to set the number of iterations for the LLE...

Page 38: ... 01 Rev A December 2020 2 27 Enable LLEC This option is available for ITMs To enable LLEC 1 Select the pulse test 2 Select Configure 3 In the right pane select Terminal Settings 4 Select Advanced 5 Select Load Line Effect as shown in the following figure 6 Select OK Figure 25 Enabling LLEC ...

Page 39: ...he typical resistance of a white SMA cable is 0 75 Ω and the typical prober pin to pad resistance is 1 Ω to 3 Ω Poorer pin to pad contacts could be in the range from 10 Ω to 15 Ω The LLEC setting does not change the maximum output voltage or current of the PMU The V Max and I Max values are the maximum output of the PMU and are valid if LLEC is enabled or disabled The DUT Resistance setting also d...

Page 40: ...Model 4200A SCS Clarius User s Manual Configure the PGU PMU and RPM using tests To configure and control the PGU a user test module UTM is needed You can also use UTMs to configure and control the PMU and RPM preamplifier For UTM programming see LPT commands for PGUs and PMUs in Model 4200A SCS LPT Library Programming You can use interactive test modules ITMs to configure and control a PMU and RPM...

Page 41: ...b 4 In the Search box type PMU and select Search The Library displays projects that are set up for PMUs 5 Select Create for the project you want to open The project replaces the previous project in the project tree Figure 26 Filter and search for the bjt project 6 Assign a new title to the project by selecting Rename and then entering and appropriate name 7 Select Enter Configure the tests To conf...

Page 42: ...the pulse voltage sweep levels of PMU1 2 on the Drain terminal and the Pulse Step Voltage of PMU1 1 on the Gate terminal as needed Figure 28 Key Parameters pane for the pulse vds id test 3 From the Test Settings pane and Advanced Test Settings dialog box adjust the Pulse Settings and Timing Parameters as needed Figure 29 Test Settings pane and Test Settings Advanced dialog box ...

Page 43: ... of test is run on the terminal Selecting the appropriate mode simplifies configuration options A Pulse Sweep and Pulse Step function are identical However in a test where two or more PMUs are used the sweep for one PMU is performed on each step of the pulse step of the other PMU A pulse step requires that at least one channel be configured for Pulse Sweep A Pulse Train outputs one or more pulses ...

Page 44: ...ng up PMUs and PGUs in Clarius 4200A PMU 900 01 Rev A December 2020 3 5 Figure 31 Pulse operation modes Figure 32 Pulse train When DC Bias operation mode is selected the PMU outputs the dc base voltage The following figure shows a representation of a dc voltage waveform ...

Page 45: ...t which the sweep starts Stop PMU Amplitude Sweep The voltage source level at which the sweep stops Step Pulse Amplitude Sweep The voltage size of each step of the sweep The source level changes in equal steps of this size from the start level to the stop level A measurement is made at each source step including the start and stop levels Clarius never steps the force voltage beyond the value speci...

Page 46: ...d by Clarius using the information entered for the Start Stop and Step parameters using the equation Base The voltage offset from 0 V that is the reference for the pulse amplitude Amplitude The amplitude voltage Dual Sweep pulse When you select Dual Sweep the instrument sweeps from start to stop then from stop to start When you clear Dual Sweep the instrument sweeps from start to stop only The amp...

Page 47: ...nges of the 4225 RPM Disable outputs at completion Select this option to disable the outputs when the test completes Clear this option to leave the outputs enabled when the test completes Current Spot Mean High Makes current measurements on the amplitude Available when the Test Mode is set to Pulse I V The following figure shows an example of a spot mean measurement on pulse high amplitude and pul...

Page 48: ...ollowing table lists the current measurement ranges for the PMU when using the RPM The 10 mA measure range for the 10 V source range has better accuracy than the 10 mA range for the 40 V source range Current measurement ranges for the PMU with RPM 10 V range 40 V range 100 nA 100 µA 1 µA 10 mA 10 µA 800 mA 100 µA 1 mA 10 mA 200 mA The current range options are Auto The instrument automatically opt...

Page 49: ...d pulse low base level For a more detailed example refer to Test Mode PMU on page 3 16 Figure 37 Spot mean measurements Voltage Spot Mean Low Makes voltage measurements on the base level Available when the Test Mode is set to Pulse IV The following figure shows an example of a spot mean measurement on pulse high amplitude and pulse low base level For a more detailed example refer to Test Mode PMU ...

Page 50: ...y Programming PMU measurement status ITMs can provide status information for the 4225 PMU measurements in the Analyze sheet Run tab The column for the status codes is labeled PMUx_y_S where x is the PMU instrument number PMU1 PMU2 and so on and y is channel number channel 1 or 2 The PMU status code indicates pulse measurement status source and measure ranges whether an RPM is connected and load li...

Page 51: ... a measurement fault occurs a message appears in the upper left corner of the graph The figure in PMU and RPM measure ranges are not source ranges on page 3 38 shows a measurement overflow on the Graph The following figure shows a graph with a PMU Measurement Overflow condition When troubleshooting a measurement fault such as the shown measurement overflow use the measurement status code to determ...

Page 52: ...reshold reached F 0 No measurement overflows G 2 10 µA measure range H 1 Channel 1 10 V measure range PMU measurement status codes Code letter Summary or description Value A Load line effect compensation LLEC and sweep 0 LLEC disabled sweep not skipped 1 LLEC failed sweep not skipped 3 LLEC successful sweep not skipped 4 LLEC disabled sweep skipped 5 LLEC failed sweep skipped 7 LLEC successful swe...

Page 53: ...M only 1 1 µA RPM only 2 10 µA RPM only 3 100 µA 4 1 mA RPM only 5 10 mA 6 200 mA 7 800 mA H Channel number and voltage measure range 1 Ch1 10 V 2 Ch2 10 V 5 Ch1 40 V 6 Ch2 40 V Compensation Short Connection Use to enable or disable short connection compensation Refer to PMU connection compensation on page 2 18 for detail on setting up and using connection compensation Load Line Effect Compensatio...

Page 54: ...ction of the DUT response and test configuration Generally smaller voltage step sizes will reduce the amount that the signal exceeds the threshold You can specify more than one threshold for each channel Threshold Voltage The voltage threshold allows you to set a voltage threshold If the threshold is reached or exceeded the present sweep is stopped Testing continues with any subsequent sweeps This...

Page 55: ...m is graphed voltage and or current versus time in the Analyze graph The pmu 1ch wfm project provides an example of a waveform capture Note that the Timing Sweep Step option in the Advanced dialog box is disabled when Waveform Capture is selected For pulse I V spot mean measurements are made on pulse amplitude and base level You can measure voltage and current The following figure shows the measur...

Page 56: ...dow for the pulse I V test mode or the pre and post data settings for the waveform measurements For ITMs the measure window and pre data and post data settings are fixed Function descriptions are provided in Model 4200A SCS LPT Library Programming Measure Mode For Measure Mode you can select Average Pulses or Discrete Pulses When Average Pulses is selected for Pulse IV the measured values of two o...

Page 57: ... yielded for each pulse The result of the three averaged readings is placed in the Analyze sheet Figure 44 Pulse IV Average pulses Pulse I V Discrete pulses measurement example For the example shown in the following figure the readings are the result of a pulsed IV sweep from 2 V to 5 V in 1 V steps with the discrete number of pulses set to three This test yields the spot mean of the three pulses ...

Page 58: ...0 If you enabled autorange load line effect compensation LLEC or thresholds the number of pulses is output multiple times for each step in a sweep Timing Sweep You can only step the timing parameters if the Operation Mode is set to pulse sweep or pulse train not pulse step and if Test Mode is set to Pulse IV You can only sweep the timing parameters if the Operation Mode is set to pulse step or pul...

Page 59: ...nnel is not pulsing This time allows for analog to digital A D sample processing and if enabled measure ranging and LLEC For more information on LLEC see How LLEC adjusts pulse output to the target levels on page 2 22 Period The pulse period is the time interval between the start of the rising transition edge of consecutive output pulses as shown in the following figure To minimize self heating ef...

Page 60: ...val is not affected If the transition time is increased the pulse would not reach its programmed amplitude 100 Figure 49 Pulse width Rise Time The rise transition time for the pulse output Fall Time The fall transition time for the pulse output Pulse Delay The pulse delay is the time interval between the start of the rising pulse edge of the trigger output pulse and the output pulse You can set th...

Page 61: ...r each current measure range Longer times may be required to accommodate DUT and interconnect settling Figure 51 Typical minimum timing recommendations When using autorange with an RPM connected use the timing values on the top row or longer slower values If using limited autorange start with the timing values for that range If pulse width or period timing parameters are too narrow for a chosen me...

Page 62: ...tling time Sweep Master Designates which instrument is the master if there are multiple steps or sweeps in a test Refer to Step or sweep multiple device terminals in the same test on page 3 40 for detail Output Values If you are using subsites each time a subsite is cycled the measurements for the selected Output Values are placed in the Analyze sheet for the subsite For example if the subsite is ...

Page 63: ...nt PMU channels in the test The illustrated pulse waveforms are defined by the Pulse Timing settings for the specific PMU This graphical depiction provides a representation of parameter values no signals are output to the test device It is not intended to be a strict definition of the actual number of pulses or pulse voltages that will be applied to the device under test DUT When the actual test i...

Page 64: ...ettings dialog box select Test Settings then Advanced see following figure Figure 54 Timing button PDU Definition tab Review the following examples to understand the Pulse Timing Preview feature PMU amplitude sweep example one channel This figure illustrates the configuration for a pulse amplitude sweep using a single PMU channel Figure 55 One channel PMU amplitude sweep ...

Page 65: ...e pair of vertical black lines on the Entire Test graph defines the content of the upper graph the upper graph is labeled Expanded View Note that the test from the previous figure defines the six sweep points that are shown in the bottom graph of the following figure as six pulse periods In this example the pulse periods have voltage amplitude increasing from 0 V to 5 V this is defined in previous...

Page 66: ...nine sweep points On each inner loop PMU1 2 sweeps 0 V through 4 V in 0 5 V increments The stepping channel is performing pulse amplitude steps with four step points On the outer loop PMU1 1 pulses the four steps of 1 V through 2 5 V in 0 5 V increments Operation modes and voltages for following figure PMU1 1 blue waveform PMU1 2 light blue waveform Operation modes Pulse Amplitude Step Pulse Ampli...

Page 67: ... to three instead of one and only displaying one channel PMU1 1 instead of Show All changes the preview of the waveform see the following figure Each point in the step now uses three periods so there are three pulses shown in the Expanded View In the Expanded View the x axis shows the time in seconds This is three times longer than the Expanded View graph when number of pulses is set to one see pr...

Page 68: ... step The PMU amplitude sweep and step example two channel test figure shows PMU1 1 the stepper with the number of pulses changed to three Notice that each sweep point of the displayed waveform in the figure has three pulses number of pulses set to three The light blue waveform in the figure has one pulse number of pulses set to one Because the cursor in the lower graph always contains the complet...

Page 69: ...e following table When the channel count is higher using the zoom feature provides a more detailed view of the individual channel Expanded View zoom On the Expanded View graph drag the cursor to define the area to magnify the cursor changes to a magnifying glass Note that each channel has a unique color and line width When the channels overlap narrower lines are shown on top of the wider lines To ...

Page 70: ...n mode Pulse amplitude step Pulse amplitude sweep Pulse voltage train Pulse voltage train Start voltage 1 5 0 1 5 0 5 Stop voltage 3 4 Step voltage 0 5 0 0 Number of points 4 5 Not applicable The pulse voltage trains are fixed pulse voltage levels they do not vary during the sweep or step points See the previous table for the key test parameters used in the following figure Figure 60 Four channel ...

Page 71: ...the Expanded View After you zoom in you can also scroll or move the viewable area of the graph See the following figure for a view of moving the lower graph using the mouse pointer Note the gaps between the pulse waveforms shown in the Expanded View zoom on page 3 30 figure gaps also exist in the following figure These gaps indicate the time between sweep points where the PMU performs calculations...

Page 72: ...It is possible to have a test with too many pulses to be suitably graphed This may be from too many pulses from a large number of sweep points or step points or a large number of pulses The following figure shows the output Too many pulses to graph for the lower graph Note that this does not mean that the test will not run If you select OK on the PMU Advanced Test Settings dialog box and it does n...

Page 73: ...prevents use of one or more PMU or RPM measure ranges the note in the center of the window turns red and lists the unavailable ranges Access the PMU force measure options by clicking the FORCE MEASURE button The Typical Minimum Timing Recommendations dialog box shows the recommended minimum pulse widths and transition rise and fall times for each current measurement range These times are the minim...

Page 74: ...t charges and discharges the capacitance in the system see following figure red waveform This system capacitance consists of the cable capacitance PMU with RPM if connected capacitance and device capacitance The following figure shows the pulse waveform showing capacitive charging and discharging current waveform in relation to the applied voltage waveform of the PMU connected to the supplied 2 m ...

Page 75: ... voltage amplitude divided by the rise or fall time The equation shows that this effect is a function of the capacitance as well as the dV dt Therefore minimizing the capacitance will reduce this measurement artifact The cabling is typically the largest contributor to the system capacitance Slowing down the pulse transitions will also reduce the height of the current charging effect This capacitiv...

Page 76: ...l 2 does not show the capacitive charging effects Also note that the channel 2 current measurement is negative because the current is flowing into channel 2 Figure 67 Setup for low side measurement In the previous figure the voltage pulse is applied by channel 1 channel 2 does not pulse Therefore there is no dV dt and therefore there are no charging or discharging currents during the pulse transit...

Page 77: ...is goal is handling the capacitive charging effects during the pulse transitions Since the interconnect and the DUT always have some capacitance it is best to charge up this capacitance as quickly as possible This can be done by allowing the maximum amount of current to flow into the capacitor during charging This may cause an overflow for the measure range during transitions especially on the low...

Page 78: ...itude of waveforms that the 4220 PGU and 4225 PMU may generate A test exceeding these internal limits generates error code 830 see pulse_init in Model 4200A SCS LPT Library Programming for more information To fix this problem increase pulse period decrease voltage amplitude or both Configure the PGU PMU and RPM using tests To configure and control the PGU a user test module UTM is needed You can a...

Page 79: ...e is in Update the RPM configuration in Model 4200A SCS Setup and Maintenance Step or sweep multiple device terminals in the same test Multiple steps or sweeps in an interactive test module ITM must track with regard to step number and duration For example you might want to apply multiple steps to multiple device terminals such as when stepping the biases on two transistor terminals and sweeping v...

Page 80: ...Model 4200A SCS Pulse Card PGU and PMU User s Manual Section 3 Setting up PMUs and PGUs in Clarius 4200A PMU 900 01 Rev A December 2020 3 41 Figure 70 Master and subordinate sweeps ...

Page 81: ...ation in the Test Settings pane When a master is set Clarius sets the points and step size values for the subordinate terminal to be the same as the settings for the master terminal You cannot change the subordinate points value for the subordinate terminal For list sweeps the number of points in the list items for the subordinate is changed to match the number of points in the master If points ar...

Page 82: ... that you want to designate as the master Basic troubleshooting procedure If the test pulse I V results do not meet expectations use the following steps as a guide for troubleshooting Because the pulse I V results extract the spot mean measurements from the top of the pulse good pulse I V results require a reasonable pulse shape Step 1 Verify prober connections from the PMU or RPM to the DUT 1 Use...

Page 83: ...x By default the voltage waveforms are blue and use the left Y1 axis the current waveforms are red and use the right Y2 axis 8 Save the project 9 Run the test and view the waveform on the graph While viewing the graph check that the voltage has a fairly flat top without significant ringing or oscillations There may be current peaks during the pulse transitions The peaks during the transitions are ...

Page 84: ...rm has a good shape Step 2 Verify the pulse shape and the pulse level is correct Step 3 Is the pulse level correct for each channel but the pulse I V curve is suspect perform the steps below In this procedure you set test parameters to provide boundaries for the test envelope When load line effect compensation LLEC is disabled the source voltage must be bounded LLEC may not respond properly for a ...

Page 85: ...of 3 W and a voltage threshold of 12 V is shown in the Vd Id family of curves with LLEC disabled figure Note that each threshold allows the test to be bounded Also note that the thresholds do not stop the test at exactly the threshold value but only after the threshold has been exceeded One test point always exceeds the threshold You can reduce the amount that the threshold is exceeded by using sm...

Page 86: ...d 12 V Note that the top curve in the red circle did not reach the 12 V setting This is because the PMU 40 V source range reached source compliance In this case the PMU is at its limit and cannot source any more voltage or current to this particular resistance See the 4200A SCS Parameter Analyzer Datasheet for more information on the PMU maximum source power versus device resistance You can access...

Page 87: ... results UTM troubleshooting also involves error messages or codes Typically the user modules are written for a specific test or requirement and have minimal error checking This means that parameter values or combinations of parameter settings may cause an error which is the primary feedback about the test status This error may be generated from within the user module or by an LPT command The foll...

Page 88: ...the 4225 RPM an error results This example test is configured to use SMU1 SMU1 is connected through RPM1 of the system 1 Set the SMU_ID from NONE to SMU1 2 Select Analyze and view the Messages area at the bottom of the screen for error messages For example if you get a message indicating forcev Cannot force when not connected you can check the Return Values in the Help pane for more troubleshootin...

Page 89: ... be necessary to research further using additional error codes Three digit negative error codes are most likely LPT command error codes Refer to LPT Library Status and Error codes in Model 4200A SCS LPT Library Programming One digit four digit or five digit error numbers are most likely from the user module so refer to the user module description for information about these type of errors ...

Page 90: ...ules When the RPM is used as a preamplifier for the PMU it provides additional low current measurement ranges When the RPM is used as a switch it switches between the PMU SMUs and CVUs LPT functions that pertain to the PGU and PMU are documented in LPT commands for PGUs and PMUs in Model 4200A SCS LPT Library Programming To do quick tests with minimal interaction with other 4200A SCS test resource...

Page 91: ...Each channel has two dedicated A D converters to simultaneously measure current and voltage The PMU controller controls the two output channels and any RPMs connected to it The solid state relays SSRs are high speed and are used to test flash memory The mechanical output relays are low leakage The block diagram for the PGU is similar except it does not have measure capability and does not have the...

Page 92: ...ment types PMU The following table summarizes pulse measurement types that are available through LPT commands for the 4225 PMU See Measurement types on page 4 23 for detailed information Pulse measurement types Measurement type Description Spot mean discrete Samples a portion of the high and low levels The samples are averaged to yield a single current and voltage reading for the high level and lo...

Page 93: ...on page 4 26 for details on the discrete pulses measure mode for waveform capture For UTM programming the discrete pulse measure mode is called waveform discrete The pulse_meas_wfm function is used to select the discrete acquisition type Average pulses For pulse I V spot mean the mean values of two or more pulses are averaged Think of it as the mean of the means For waveform capture each acquired ...

Page 94: ...ot testing The second part is the power required by the instruments taking part in the test Note that medium power SMUs 4200 SMUs and 4201 SMUs 4200 preamplifiers 4200 PAs and 4210 CVU and 4215 CVU modules are not included in the equations as their power draw is not significant 4200A SCS power requirements Instrument Idle power Test power High Power SMU 4210 SMU or 4211 SMU Not significant 45 4225...

Page 95: ...54 6 nC40 45 0 8 4 0 54 6 5 273 PowerTOTAL PowerIDLE PowerTEST 235 2 273 508 2 This test has PowerTOTAL 500 so this test will not proceed Reduce the number of PMU RPM channels that are set to the 40 V range to less than five The following table shows the 4200A SCS power requirements for valid combinations for the 4225 PMU 4225 RPM and high power SMU 4200A SCS power requirements for valid combinati...

Page 96: ...ure concepts Ultra fast I V sourcing and measurement have become increasingly important capabilities for many technologies including compound semiconductors medium power devices nonvolatile memory microelectromechanical systems MEMs nanodevices solar cells and CMOS devices Using pulsed I V signals to characterize devices rather than DC signals makes it possible to study or reduce the effects of se...

Page 97: ...readings taken in a predefined measurement window on the pulse This average of readings is called the spot mean You can define the parameters of the pulse including the pulse width duty cycle rise and fall times amplitude and so on Transient I V or waveform capture is a time based current including voltage measurement that is typically the capture of a pulsed waveform A transient test is typically...

Page 98: ...imit to the number of samples one million that can be acquired per A D test When a test is configured to exceed that limit the sample rate is automatically lowered when using ITMs so that fewer than one million samples are acquired Pulse I V spot mean The maximum number of samples per A D per test is 1 000 000 one million If an ITM is configured to yield more than one million samples Clarius autom...

Page 99: ...oltage waveform the red represents the measure windows This figure contains a 12 segment waveform Figure 83 Example of waveform measured using seg_arb_sequence Two types of measurements are supported spot mean and sample Spot mean measurements take a mean of all the samples within the measured window and result in a single reading for that segment The sample measurement reports all of the samples ...

Page 100: ...oating condition The minimum time for a segment with a HEOR transition open to close or close to open is 25 µs for the 4220 PGU and 4225 PMU Because of resources necessary to generate the Segment Arb waveforms an additional 10 ns interval is added to the end of the last segment of a Segment Arb waveform During this interval the output voltage HEOR and trigger output values remain the same as the f...

Page 101: ...equences with looping is illustrated in the following figure Figure 85 Definition showing two sequences with looping The graph of the measurement of a two sequence Segment Arb with looping from UTM pmu segarb complete in the pmu dut examples project is shown in the following figure Figure 86 Graph of the waveform two sequence with looping measurement ...

Page 102: ...s own unique voltage value A time interval is set to control the time spent at each point in the waveform The following figure shows an example of a user defined full arb waveform The waveform is made up of 80 voltage points with the time interval between each point set to 10 ns Use the arb_array function to define a full arb waveform This function includes parameters to specify the number of wave...

Page 103: ...n page 4 14 Pulse waveforms for nonvolatile memory testing The pulse card has several attributes that support nonvolatile memory NVM testing To perform the multi level pulse waveforms for the typical program erase waveform each pulse card channel uses the Segment Arb mode For more information about Segment Arb waveforms refer to Segment Arb waveforms on page 5 5 The ability to disconnect or float ...

Page 104: ...or a waveform that is 20 48 µs wide is calculated as follows Number of samples rows Sample rate x waveform width 200e6 x 20 48 µs 4096 If the waveform is any wider the sample rate is automatically lowered by Clarius to fit the waveform within the 4096 points Waveform width that is sampled includes pulse rise pulse magnitude pulse fall and a small portion of the base level before the rise and after...

Page 105: ...channel and the DUT resistance effectively make a voltage divider Ohm s law is the only concept required to determine IDUT and VDUT in this simple non dynamic approach Calculate the current and then use the current to calculate the voltage across the DUT Example 1 Ideal situation 50 Ω DUT The ideal situation 50 Ω DUT is shown in the figure below RDUT 50 Ω Pulse VHIGH 5 V Pulse VLOW 0 V Pulse load ...

Page 106: ...he DUT will not match the programmed voltage level Calculate VDUT VDUT IDUT RDUT 0 1 A 50 Ω 5 V Example 2 High resistance DUT A high resistance DUT is shown in the following figure RDUT 1 MΩ Pulse Vhigh 5 V Pulse Vlow 0 V Pulse load 50 Ω Figure 90 5 V pulse into a 1 MΩ DUT load This example shows a 5 V pulse into a 1 MΩ DUT load Calculate the current IDUT IDUT VTOTAL RTOTAL VINT 50 Ω 1 MΩ 10 V 1 0...

Page 107: ...xamples Only the DUT load RDUT was changed resulting in a range of VDUT from less than 1 V to nearly 10 V with corresponding changes in IDUT This variation is related to the constant pulse load 50 Ω Reprogramming the pulse load value to match RDUT would prevent this behavior but is not practical in many situations This effect is inherent to the pulse generator and DUT system The general approach f...

Page 108: ... V Range table for the 250 Ω row These calculations do not incorporate any cabling or interconnect losses that may range from 1 Ω up to 10 to 20 Ω depending on the interconnect method and DUT type packaged or on wafer The tables below show the maximum current and voltage for various RDUT values for the two output ranges available on each pulse card channel Note the calculated current and voltage v...

Page 109: ... 33 333 0 133 1 k 38 095 0 038 10 k 39 801 0 00398 Approximate value does not account for interconnect losses Triggering Triggering is used for the following operations Basic triggering on page 4 21 Configure the Keithley pulse card for the trigger mode Continuous Burst or Trig Burst and use a software trigger to start pulse output Pulse measure synchronization on page 4 22 Synchronize the pulse m...

Page 110: ...er The LPT function for the software trigger also sets the trigger mode Enabled pulse generator channels will then output a continuous string of pulses continuous trigger mode or a burst of pulses burst or trig burst trigger mode Software trigger source To use a software trigger to start pulse output the software trigger source must first be selected The pulse_trig_source function is used to selec...

Page 111: ...ization Synchronize the pulse measure operation of a pulse generator card Pulse generator card output trigger When output trigger is enabled an output pulse will initiate a TTL level 50 duty cycle output trigger pulse The trigger pulses are available at the TRIGGER OUT connector of the pulse generator card The figure below shows the behavior of output triggers TO for the three trigger modes Notice...

Page 112: ... mean and waveform The pulse_meas_sm function is used to configure Spot mean measurements on page 4 24 and the pulse_meas_wfm function is used to configure Waveform measurements on page 4 25 The Model 4225 PMU makes the following types of pulse measurements Spot mean discrete Spot mean average Waveform discrete Waveform average Use the following pulse generator functions to configure pulse measure...

Page 113: ...erage readings on page 4 25 If you enable both amplitude and base spot means each pulse has two voltage measurements and two current measurements see pulse_fetch Spot mean discrete readings The averaged voltage and current readings for every sampled pulse period are returned in a single data set The figure below shows how spot mean discrete readings are returned as a data set for two pulse periods...

Page 114: ...ll voltage and current readings enabled four readings are returned for the burst When time stamps are enabled a timestamp is included in the data set after each mean of the means reading Figure 94 Returned data set for spot mean average readings Waveform measurements Waveform measurement readings sample the entire pulse Sampling is performed on the rise time top width and fall time portions of the...

Page 115: ...orm measurement timing on page 4 28 for details on measurement timing for pre data and post data Figure 96 Waveform measurements with pre data and post data Waveform discrete readings Enabled voltage and or current readings and time stamps for every sample of the waveform are returned in a single data set The following figure shows how waveform discrete readings are returned as a data set for two ...

Page 116: ...ean measurement type samples a portion of the amplitude and a portion of the base level The measured samples are then averaged to yield a single voltage and current reading for the amplitude and base low levels The NumPulses number of pulses parameter specifies the number of pulses to be output and sampled The figure below shows that three measured samples are taken on the amplitude and six sample...

Page 117: ...ation 100 of the pulse This includes the rise time amplitude and fall time portions of the pulse A voltage and or current reading is returned for every sample A waveform measurement can include pre data and post data Pre data is extra data taken before the rise time of the pulse post data is extra data taken after the fall time Waveform measurements on page 4 25 shows an example where 10 0 1 pre d...

Page 118: ...0 1 1 Where Instr_id PMU1 chan 1 channel 1 AcquireType 0 discrete AcquireMeasVAmpl 1 enable AcquireMeasVBase 0 disable AcquireMeasIAmpl 1 enable AcquireMeasIBase 0 disable AcquireTimeStamp 1 enable LLEComp 1 enable Example pulse_meas_wfm This function sets channel 1 of the PMU for the waveform discrete measure type to acquire the voltage current readings for the waveform and the time stamps It als...

Page 119: ...1 Rev A December 2020 Example pulse_meas_timing This function sets the following pulse measure timing settings for five spot mean measurements for channel 1 of PMU1 pulse_meas_timing PMU1 1 0 6 0 8 5 Where Instr_id PMU1 chan 1 channel 1 StartPercent 0 6 60 StopPercent 0 8 80 NumPulses 5 output one pulse ...

Page 120: ... KPulse can be launched at the same time as Clarius KPulse and Clarius cannot communicate with hardware simultaneously Starting KPulse To open KPulse double click KPulse on the desktop The following example shows one PMU installed in the system From the user interface each pulse generator can be used to configure and control the following waveform types Standard pulse waveforms on page 5 3 and Seg...

Page 121: ...alog box which includes the following options Show Pulse Mode Graphs When enabled shows the Standard Pulse waveform previewers for each pulse card tab Show Segment Arb Graphs When enabled shows the Segment Arb pulse waveform previewers for each pulse card tab Show File Arb Graph When enabled shows the Custom File Arb pulse waveform previewer for each pulse card tab Show Arb Generator Graph When en...

Page 122: ...ty must be positive If you are using a falling edge trigger source the pulse trigger polarity must be negative This requirement applies to all pulse modes including Standard Pulse Segment Arb and Full Arb When triggering multiple pulse cards in a master subordinate configuration changing the trigger output polarity of the master card results in a transition in the trigger output levels that may be...

Page 123: ...ure 102 Standard pulse operation settings Set waveform trigger output and general settings 1 Select the pulse card tab in this example PMU1 2 For the Waveform Type select Pulse 3 For the Trigger Source select External 4 Select the Trigger Source type Per Pulse Rising Initial Falling Initial Rising or Per Pulse Falling 5 For the Output Mode select Continuous Mode or Burst Mode 6 Under General Setti...

Page 124: ...d 6 To turn off the output select Output Off Segment Arb waveforms Segment Arb waveforms are configured and controlled from the PGU or PMU tab in KPulse The below figure explains how to use KPulse for segment Arb output Due to the Segment Arb engine overhead there is an additional 10 ns interval added to the end of the last segment of a Segment Arb waveform During this interval the output voltage ...

Page 125: ...is example PMU1 2 For the Waveform Type select Segment Arb 3 For the Trigger Source select External 4 Select the Trigger Source type Per Pulse Rising Initial Falling Initial Rising or Per Pulse Falling 5 For the Output Mode select Continuous Mode or Burst Mode 6 Under General Settings set the Pulse Period in seconds 7 Set the Trigger Polarity to Positive or Negative 8 Select how to apply the chang...

Page 126: ...nt enter the Start voltage Stop voltage Time in seconds the TTL output Trig level 0 low 1 high and the state of the SSR solid state relay 0 open 1 closed 5 Select OK 6 Select the Output On button to turn on all enabled channels for all pulse cards installed on the 4200A SCS Output Off turns red 7 To turn off the output select Output Off Exporting Segment Arb waveform files After configuring a Segm...

Page 127: ...s Manual Custom file arb waveforms full arb The following figure summarizes the basic processes to create a custom full arb waveform file to load the file into a pulse card and to output the pulse waveforms Figure 105 Basic process to create and output custom file Arb waveforms To create custom file arb waveforms full arb 1 Select and configure waveforms After you select an available waveform type...

Page 128: ...a kaf file See Custom Arb file operation Copy waveforms into Sequencer on page 5 10 4 Load the kaf waveform file into a pulse generator using the appropriate pulse card tab Refer to Custom Arb file operation Load waveform and turn on output on page 5 12 for details 5 Turn on the output for enabled channels See Custom Arb file operation Load waveform and turn on output on page 5 12 Custom Arb file ...

Page 129: ...ther waveform in the Scratch Pad Custom Arb file operation Copy waveforms into Sequencer To copy waveforms into the Sequencer 1 Select the Arb Generator tab 2 Select Scratch Pad or Sequencer Scratch Pad previews the waveform that is selected in the Scratch Pad Sequencer previews enabled waveform sequences To preview the waveforms in the Sequencer select Enable Channel 1 or Enable Channel 2 3 Selec...

Page 130: ...r selecting a waveform in the Scratch Pad or Sequencer select the appropriate Delete button to remove it Note that deleting a waveform from the Scratch Pad also removes it from the Sequencer 8 Set the Time per Point in seconds This is the time interval between each point in the waveforms 9 Save the waveforms as a Keithley Arb File kaf By default kaf files are saved in the folder C s4200 kiuser KPu...

Page 131: ...r both of the channels If the kaf file was saved with one or both channels enabled the kaf file loads into this tab with the same channels enabled A channel must be enabled in order to preview and output its waveform The waveform for Channel 1 is blue and the waveform for Channel 2 is red 5 Configure triggers for both channels of the pulse card Trigger Source Software External or Internal Bus With...

Page 132: ...ilding blocks for custom file arb Sine waveform on page 5 14 Square waveform on page 5 14 Triangle waveform on page 5 15 Custom waveform on page 5 15 Calculation waveform on page 5 17 Noise waveform on page 5 17 Gaussian waveform on page 5 18 Ramp waveform on page 5 18 Sequences waveform on page 5 20 As explained in Custom Arb file operation Select and configure waveforms on page 5 9 a waveform is...

Page 133: ...the Scratch Pad After changing one or more settings select Preview to display the waveform Select OK to place the waveform in the Scratch Pad Figure 109 Sine waveform Square waveform An example of a square waveform is shown in the following figure The waveform for this example is named WAVE3 but can be any name that is not already used in the Scratch Pad After changing one or more settings select ...

Page 134: ...e waveform Select OK to place the waveform in the Scratch Pad Figure 111 Triangle waveform Custom waveform An example of a custom waveform is shown in the following figure The waveform for this example is named CUSTOM1 but can be any name that is not already used in the Scratch Pad The voltage values for the waveform are retrieved from an imported file txt or csv After creating a file txt or csv f...

Page 135: ...he list of voltage points 1 Open a text editor 2 On the first line type the number of voltage points in the waveform and then type the list one per line of values for the waveform txt file format As shown in the below figure commas are not used to separate values csv file format As shown in the below figure commas are used to separate values Only the first column of data is used for the waveform A...

Page 136: ...ure The waveform for this example is named CALC1 but can be any name that is not already used in the Scratch Pad The calculation add subtract multiple or divide performs the selected math operation on two selected Scratch Pad waveforms In the following example example SINE1 is added to Ramp After selecting the two waveforms and the math operation select Preview to display the result of the calcula...

Page 137: ...eform Gaussian waveform An example of a Gaussian waveform is shown in the following figure The waveform for this example is named GAUSSIAN1 but can be any name that is not already used in the Scratch Pad After changing one or more settings select Preview to display the waveform Select OK to place the waveform in the Scratch Pad Figure 116 Gaussian waveform ...

Page 138: ...19 Ramp waveform An example of a ramp waveform is shown in the next graphic The waveform for this example is named RAMP1 but can be any name that is not already used in the Scratch Pad After changing one or more settings select Preview to display the waveform Select OK to place the waveform in the Scratch Pad Figure 117 Ramp waveform ...

Page 139: ...elow graphic The waveform for this example is named SEQ1 but can be any name that is not already used in the Scratch Pad A sequence waveform consists of the waveforms that are present in the Channel 1 or Channel 2 Sequencer After selecting either Channel One Sequencer or Channel Two Sequencer select Preview to show the waveform Select OK to place the waveform in the Scratch Pad Figure 118 Sequence...

Page 140: ...U and 4225 PMU and make dc I V C V and pulsed I V measurements to a single device without having to reconnect the device between measurements For this example you Make connections from two SMUs one CVU and the two channel PMU to the inputs of two 4225 RPMs Make connections from the outputs of the two 4225 RPMs to a diode Generate dc I V C V and pulsed I V measurements Equipment required One 4200A ...

Page 141: ...n application is used to manage the configuration of the 4200A SCS including the 4225 RPM Before using an RPM for automatic switching you must update the RPM configuration in KCon This associates the instruments connected to each RPM and enables automatic switching between tests To update the RPM configuration in KCon 1 Make sure your device under test is disconnected from the RPM output terminals...

Page 142: ... the two 4225 RPMs and then from the output terminals of the two RPMs to the diode under test as shown in the following figure The Sense and Force output terminals of 4200 SMU or 4201 SMU Channel 1 are connected to the SMU Sense and SMU Force connections of 4225 RPM Channel 1 using 4200 TRX 2 or 4200 MTRX 2 triaxial to triaxial cables The same connection is made between 4200 SMU or 4201 SMU Channe...

Page 143: ... 120 Connections from the 4200A SCS and 4225 RPMs to the diode Connect the 4200A SCS to the DUT The following figure shows the 4200A SCS rear panel connections to the input terminals of two 4225 RPMs and from the outputs of the 4225 RPMs to the diode Figure 121 Rear panel connections to the inputs of the 4225 RPM units and from the units to the device ...

Page 144: ...pe For this example you use the Clarius application to Create a new project Add a device Search for and select existing tests in the Test Library Configure the tests Run the tests View and analyze the test results Create a new project To create a new project 1 Choose Select Figure 122 Select highlighted 2 In the Library select Projects 3 Select New Project 4 Select Create Figure 123 Select a New P...

Page 145: ...t the Diode 2 terminal device 5 Select Add to add it to the project tree Figure 124 Select and add a diode device to the project tree Search for and select existing tests in the Test Library To search for and select an existing test 1 Select Tests 2 To find a diode test in the Test Library type the word diode in the search box then select Search 3 Scroll to find the Diode Forward I V Sweep vfd tes...

Page 146: ... the project tree 5 Scroll to find the Diode C V Sweep cv diode test 6 Select Add to add this test to the project tree Figure 126 Diode C V Sweep cv diode test 7 Scroll to find the Diode Pulse I V Sweep pulse diode test 8 Select Add to add this test to the project tree Figure 127 Diode Pulse I V Sweep pulse diode test Your project tree now has three tests Figure 128 Three tests added to project tr...

Page 147: ...est To configure the vfd test 1 Choose Configure Figure 129 Configure highlighted 2 In the project tree select the vfd test 3 Adjust the Anode settings in the Key Parameters pane as needed Figure 130 Forward I V sweep vfd terminal settings 4 In the Test Settings pane select Advanced 5 Adjust the parameters as needed Be sure to include the delay between sweep steps ...

Page 148: ...020 6 9 Figure 131 Test Settings pane and Test Settings Advanced dialog box 6 Select OK to accept the settings 7 Select Terminal Settings 8 Select Advanced 9 Adjust the voltage source and current measurement parameters as needed Figure 132 Terminal Settings pane and Terminal Settings Advanced dialog box 10 Select OK to accept the changes ...

Page 149: ... diode test 1 Select the cv diode test from the project tree 2 Select the Anode terminal of the diode in the Key Parameters pane 3 Adjust the voltage source and test frequency settings as needed Figure 133 Key Parameters pane for the cv diode sweep test 4 On the Test Settings pane select Advanced Adjust the timing parameters as needed Be sure to include the sweep delay time in your adjustments ...

Page 150: ...anced and Formulator dialog boxes for the cv diode sweep test 5 On the Terminal Settings pane and the Terminal Settings Advanced dialog box of the Anode terminal adjust the parameters If you are including cable compensation values run the Tools menu option CVU Connection Compensation Refer to Perform offset compensation in the Model 4200A SCS Capacitance Voltage Unit CVU User s Manual for more det...

Page 151: ...inal Settings Advanced dialog box for the cv diode sweep test Configure the pulse diode test To configure the pulse diode test 1 In the project tree select the pulse diode test 2 From the Key Parameters pane change the Cathode terminal setting from PMU1 GND to PMU1 2 as shown in the following figure 3 Adjust the pulse operation as needed Figure 136 Key Parameters pane for the pulse diode test ...

Page 152: ...t Terminal Settings 6 Select Advanced to configure the measurements as needed including spot mean PMU compensation and PMU threshold levels Figure 137 Terminal Settings pane and the Terminal Settings Advanced dialog box for Pulse Diode test 7 Select OK 8 Select the Cathode terminal 9 Select Test Settings 10 Select Advanced to adjust the test mode and pulse timing settings as needed ...

Page 153: ...sts for the device 1 Select the diode device in the project tree 2 Verify that the check boxes for the tests and the device are selected 3 Select Run The three tests run sequentially and the RPM automatically switches the outputs between the SMU CVU and PMU 4 Select the Analyze pane to see the results As the instruments switch between tests the LEDs at the top of the RPMs change color When the out...

Page 154: ...f the 4225 RPM indicating the LED status View and analyze the test results You can select Analyze when you run the project to view test results in real time Figure 140 Analyze highlighted Select a test from the project tree to display its results The data for the vfd test is displayed in the following figure Both the data and the graph are displayed in this view ...

Page 155: ...Section 6 Use the RPM to switch the SMU CVU and PMU Model 4200A SCS Pulse Card PGU and PMU User s Manual 6 16 4200A PMU 900 01 Rev A December 2020 Figure 141 Analyze pane for the vfd test ...

Page 156: ... a time based current and or voltage measurement that is typically the capture of a pulsed waveform Transient I V measurements can be used to test a dynamic test circuit or as a diagnostic tool for choosing the appropriate pulse settings in the pulsed I V mode This section provides an example of how to use the 4225 PMU and the optional Model 4225 RPM Remote Preamplifier Switch Module to make a pul...

Page 157: ... Y adapter cables Device connections Using the supplied cables make connections from the output terminals of the two 4225 RPMs to the MOSFET Hazardous voltages may be present on all output and guard terminals To prevent electrical shock that could cause injury or death never connect or disconnect from the 4200A SCS while the output is on To prevent electric shock test connections must be configure...

Page 158: ...ate RPM Figure 142 Connections from the PMU to the RPM inputs At the output of each RPM connect the triaxial to BNC adapter BNC to SMA adapter and finally the SMA to SMA cable Connect the SMA cables to either probes or a test fixture that is connected to the MOSFET RPM1 is connected to the gate of the MOSFET and RPM2 is connected to the drain of the MOSFET The shields of the SMA cables are the PMU...

Page 159: ...ce terminals on a wafer Figure 143 Connections from RPM outputs to the MOSFET on a wafer Set up the measurements in Clarius This section describes how to set up the Clarius application to make a pulsed I V sweep on a MOSFET For this example you use the Clarius application to Create a new project Search for and select an existing test Configure the test Run the test and analyze the results Create a...

Page 160: ... 6 Assign a new title to the project by selecting Rename and then entering MOSFET Pulse I V 7 Select Enter Search for and select an existing test To search for and select an existing test 1 Select Tests 2 Type MOSFET into the search bar then select Pulse in the Filters pane under Measurements 3 Select the MOSFET Pulse I V Drain Family of Curves pulse vds id test then Add it to the project tree Not...

Page 161: ...cember 2020 Configure the test To configure the test 1 Select Configure Figure 147 Configure button highlighted 2 From the Key Parameters pane adjust the pulse voltage sweep levels of PMU1 2 on the Drain terminal and the Pulse Step Voltage of PMU1 1 on the Gate terminal as needed Figure 148 Key Parameters pane for the pulse vds id test ...

Page 162: ...anced Test Settings dialog box adjust the Pulse Settings and Timing Parameters as needed Figure 149 Test Settings pane and Test Settings Advanced dialog box 4 From the Terminal Settings pane and Advanced Terminal Settings dialog box you can adjust the voltage source and current measurement parameters as needed Figure 150 Terminal Settings pane and Terminal Settings Advanced dialog box ...

Page 163: ... Run the test and analyze the results Select Run to execute the test Figure 151 Run You can select Analyze when you run the project to view test results in real time Figure 152 Analyze highlighted The data and the graph are displayed in the Analyze pane as shown in the following figure Figure 153 Analyze results pane with data and graph displayed ...

Page 164: ...l projects that you can use to test floating gate transistors NOR NAND and other types of nonvolatile memory To use the flash memory tests you need Two pulse cards four pulse channels At least two SMUs If your system does not include switching it is best to have four SMUs to match the number of pulse channels to connect to a three or four terminal device You can use 4200 SMUs 4201 SMUs 4210 SMUs o...

Page 165: ...rconnect CS 1390 4 3 slot male triaxial to female BNC adapter Convert BNC cabling to triaxial for prober or switch matrix connection 7078 TRX BNC 4 SMA male to BNC female adapter Adapt Tee to BNC for cabling from instrument to probe manipulators CS 1252 2 10 8 cm 4 25 in white SMA cables Interconnect for triggering CA 451A 4 20 3 cm 8 in white SMA cables Interconnect between pulse card and SMU sig...

Page 166: ...tors Use the supplied torque wrench to tighten each connection as it is assembled Always connect and torque adapter cable assemblies before attaching the assembly to the instrument cards Non axial stress on the bulkhead connectors on the SMU or pulse cards could cause damage to the cards installed in the 4200A SCS chassis Pre torque the connections to prevent this damage To remove the LEMO triaxia...

Page 167: ...re 156 Graph of shifted voltage threshold VT due to stored charge on floating gate on a 1 bit 2 level cell The Flash transistors tests consist of two parts 1 Pulse waveforms that program or erase the DUT 2 DC measurements are made to determine the state of the device This implies switching between two conditions 1 Pulse resources are connected to the DUT 2 Pulse resources are disconnected and the ...

Page 168: ... other ways to provide similar electric fields and balance performance across a variety of parameters program or erase speed retention longevity adjacent cell disturbance endurance and others The following figure shows examples of tunneling to move charge to and from the FG The electric field and the preferred direction of electron flow are indicated by the black arrows The signal applied to each ...

Page 169: ... configure a simpler setup without the external switch matrix Because both the SMUs and the pulse cards have isolation relays on the cards you can configure a simpler setup without the external switch matrix The advantage of the simpler setup is lower cost However the switch matrix provides lower current measurement performance and the flexibility necessary for testing arrays of test structures To...

Page 170: ...ase pulse or a waveform made up of both program and erase pulses All of these waveforms are implemented by using the Segment Arb capability For more information about waveforms refer to Pulse Source Measure Concepts on page 4 7 The following waveforms are examples of the different methods and voltage levels for programming and erasing Figure 161 Program pulse waveforms for a floating gate DUT with...

Page 171: ...ate drain source and bulk The block diagram for the flash setup is shown in the following figure To reconfigure from the pulse stress to dc measure phases activate the switches on the SMU and pulse cards During the pulse program erase phase the relays in the pulse channels are closed and the relays in the SMUs are open For the dc measure phase the opposite is true Figure 163 Basic schematic of fla...

Page 172: ...E as the number of applied program erase cycles increases Figure 164 Example results of voltage threshold shift in an Endurance test on a NOR flash cell Connections for endurance testing no switch matrix For a direct connect configuration the minimum number of pulse channels is equal to the number of DUT terminals that need to be simultaneously pulsed including terminals that must change from conn...

Page 173: ...ory Model 4200A SCS Pulse Card PGU and PMU User s Manual 8 10 4200A PMU 900 01 Rev A December 2020 Figure 165 Flash connections program erase and endurance testing using direct connection to a single stand alone 4 terminal device ...

Page 174: ... memory 4200A PMU 900 01 Rev A December 2020 8 11 Connections for endurance testing switch matrix A switch matrix is recommended for testing array test structures for endurance or disturb Figure 166 4200 900_Flash Switch connections characterization endurance or disturb testing ...

Page 175: ...trumentation at the top of array to the flash memory cells SMU2 and SMU3 are set to output 0 V This ensures that only the Cell 2 is turned on during pulse stressing Pulse stressing The output relay for SMU1 is opened and the gate and drain of Cell 2 are pulse stressed by Pulse Card 1 ch 1 and Pulse Card 2 ch 1 Disturbed cell testing The outputs for the pulse cards are turned off and their output r...

Page 176: ...Model 4200A SCS Pulse Card PGU and PMU User s Manual Section 8 Testing flash memory 4200A PMU 900 01 Rev A December 2020 8 13 Figure 167 Flash direct DUT connections Disturb testing ...

Page 177: ...switch matrix the number of adjacent cells that can be measured is limited Therefore it is recommended that a switch matrix be used for disturb testing Using a switch matrix allows the flexibility of routing pulse and DC signals without having to make connection changes Also this type of structure uses a multi pin probe card which provides an additional opportunity for mapping test resources to DU...

Page 178: ...port Segment Arb waveforms 1 If they are open close Clarius and KCon 2 Open KPulse 3 Select File Load Setup 4 Select Kpulse_Flash_Example_01 kps 5 Select Open 6 Select Edit Segarb This opens the edit dialog box for both channels You can use copy and paste to copy information between the channels 7 Note that the trigger is set to 1 in the first and fifth segments These are the first segments in the...

Page 179: ... tests These tests are based on user modules The Segment Arb waveforms have been partially pre defined to reduce the number of parameters you need to enter The sign of the PulseVoltages array determines whether the pulse is positive usually for a program pulse or negative usually for an erase pulse The number of parameters and number of pulse channels in the test must be the same The period of eac...

Page 180: ...orm is required in the test and the Subsite Stress Properties you must make sure the waveform information is the same for both Refer to the Clarius Help pane for information on the other parameters for each test Direct connections to single DUT Cabling instructions for direct connections to a single DUT are below Also refer to the figure in Connections for endurance testing no switch matrix on pag...

Page 181: ...hese cable assemblies to connect the SMA to CHANNEL 2 of the pulse card in the left most slot pulse card in the slot with the highest number 7 Carefully insert the LEMO triaxial connector into the Force connector on the SMU in slot 4 8 Route the BNC cable from SMU4 to the DUT terminal bulk connection Connect a triaxial to BNC adapter if necessary 9 Connect the cable to the probe manipulator 10 Use...

Page 182: ...A tee 3 Connect one of the SMA cables to TRIGGER OUT of the pulse card in the lowest numbered slot 4 Connect the SMA tee to TRIGGER IN of the first pulse card 5 Connect the SMA tee to TRIGGER IN of the second pulse card which should be to the immediate left of the card in the lowest numbered slot 6 If your system includes four pulse cards connect the cables and tees as described above to the adjac...

Page 183: ... in the left most slot the pulse card in the slot with the highest number 11 Carefully insert the LEMO triaxial connector into the Force connector on the SMU in slot 3 12 Route the BNC cable from SMU3 to the DUT array BL2 connection If necessary connect a triaxial to BNC adapter 13 Connect the cable to the probe manipulator 14 Connect the SMA of one of the cable assemblies to CHANNEL 2 of the puls...

Page 184: ... and trade names are the property of Keithley Instruments All other trademarks and trade names are the property of their respective companies Keithley Instruments Corporate Headquarters 28775 Aurora Road Cleveland Ohio 44139 440 248 0400 1 800 833 9200 tek com keithley 07 2020 ...

Reviews: