159
13.17 Trend Display
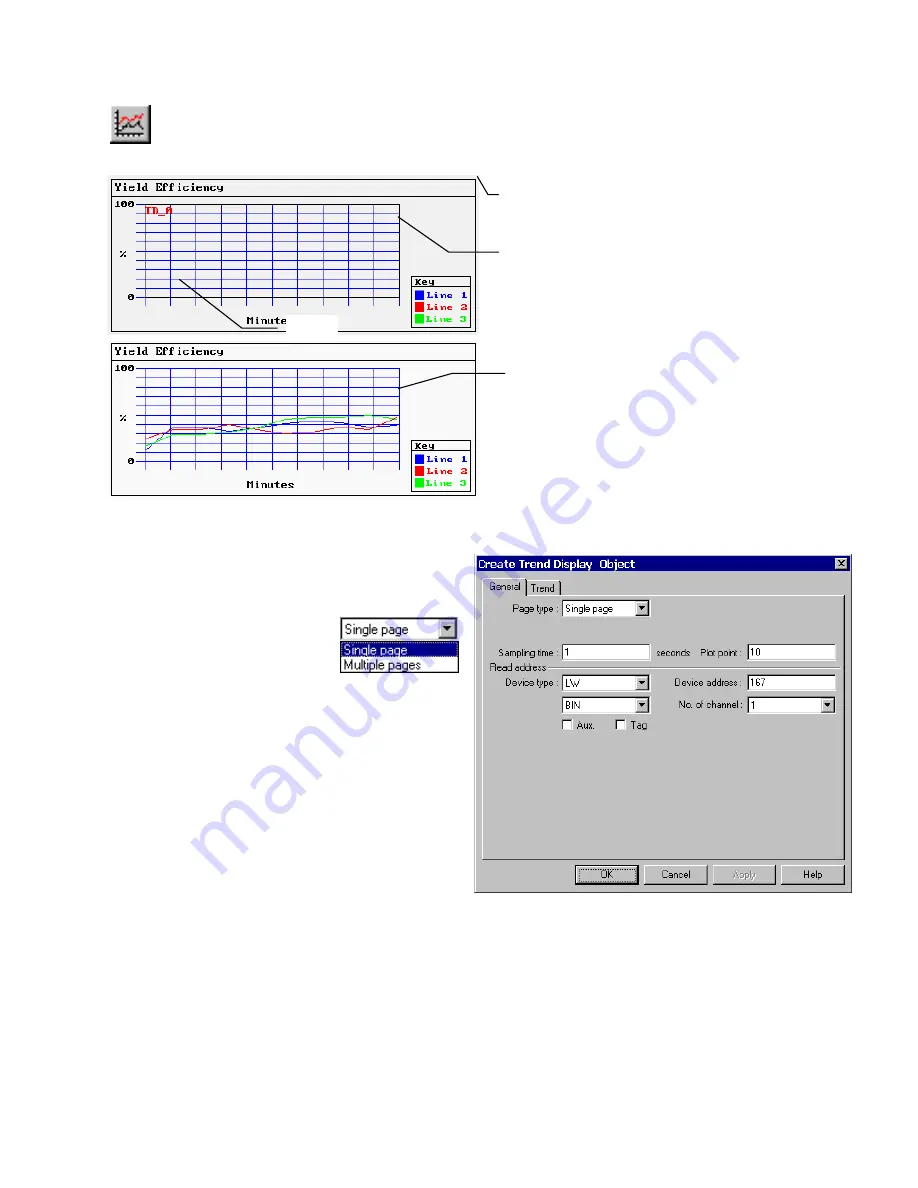
The Trend Display periodically retrieves a block of PLC data and displays the trend data over time. As each
sampling period elapses, the new data is read from the PLC and inserted towards the right side of the trend graph,
the trend graph, when full is shifted to the left direction. The Trend Display data is retrieved on a real time basis.
An example of a typical trend display is shown to the right. A
Shape is used for the background and Scales are added to
show relative information about the trend. The trend display
is then placed on the Shape.
Procedure to add a Single page Trend Display
1. Click Trend Display icon or select
Trend Display
from
the
Parts
menu.
2. Fill in General Tab Items:
Page type
: Select Single page.
Single page is a simple trend
display. Data is plotted as
described in the above example.
Sampling time
: Time between point plots in seconds.
Plot point
: the number of sample points displayed
across the length of the chart.
Read address
: Specify the PLC word address of the
first Trend data pen, the second Trend data pen starts
at read a 1, and the third starts at read
a 2, etc.
Device type
is the word prefix.
Device address
is the word number.
Data format:
Defines data from the controller as binary (
BIN
) or binary coded decimal (
BCD
).
See Word Lamp 13.2 for format description.
No. of Channel
: The number of PLC data words retrieved is the same as No. of Channel, one word per channel. Up to
16 channels can be specified for a trend.
Tag
is used to select the Read address from a list of predefined Tags.
Aux.
directs the Read address to be retrieved from the Auxiliary Port.
Trend Display Design Tip
: Too many pens can make a trend cluttered and unreadable.
Shapes
Trend Display
Scales
The newest data is inserted into the left side and
the trend graph is shifted right.
Summary of Contents for MMI-1500
Page 2: ...ii...


