background image

SiPM Evaluation Kit      Quick Start Guide 

SiPM

Eval Kit

3 Single Photon Measurements
3.1 Dark Count Spectrum

• 

 At the oscilloscope, set the trigger to the amplified SiPM signal at 0.5 pe amplitude (1 pe is the smallest 

occurring pulse height, corresponding to a photoelectron pe).

• 

Note:

 This measurement has to be done under dark conditions without illuminating the SiPM. 

• 

 Measure the area respectively the charge of the signal at the position of the trigger point in e.g. a 25 ns 

wide gate. Best results are obtained by integrating the whole positive pulse area.

• 

Histogramming of the integrated charge is the resulting dark count spectrum.

• 

Note:

 E.g. crosstalk probability can be extracted from the dark count spectrum. 

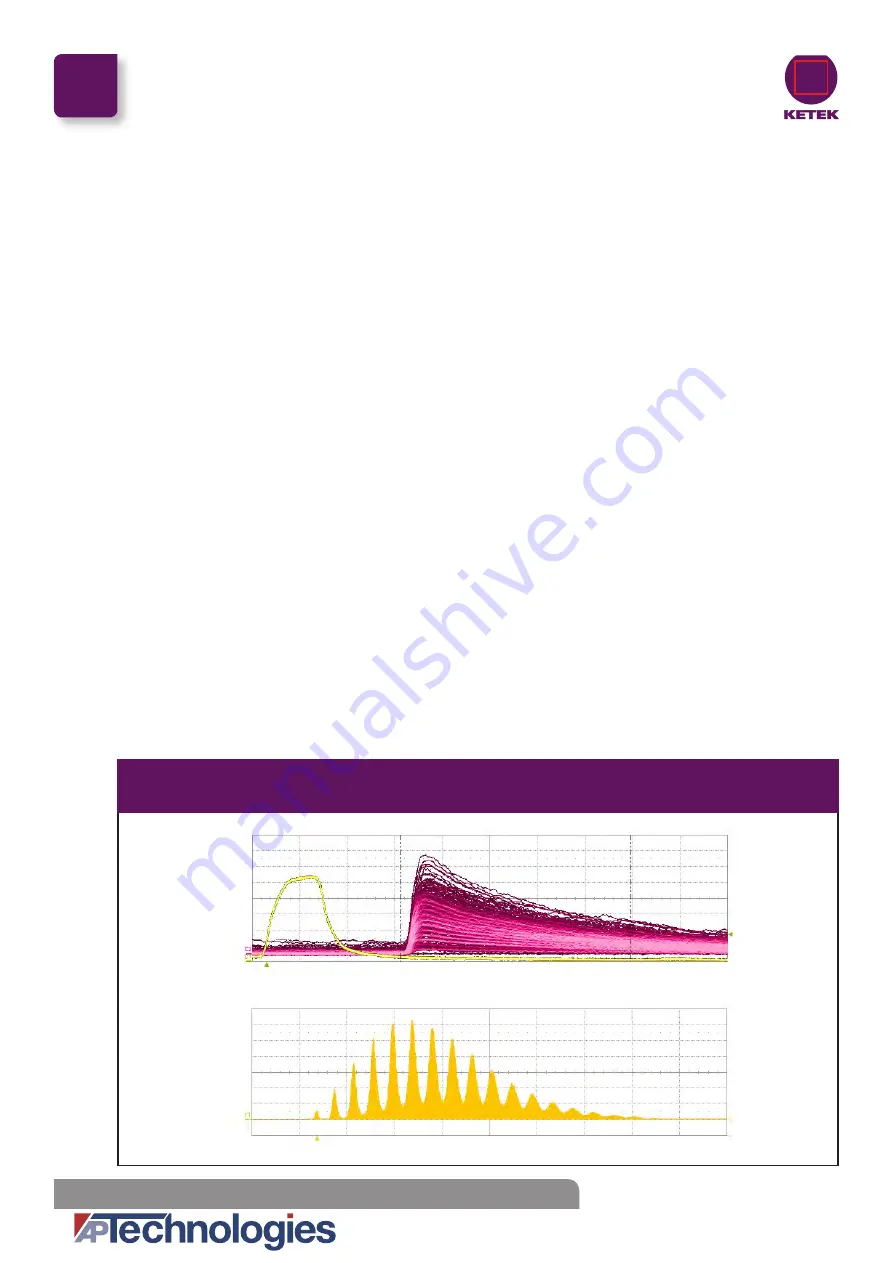
3.2 Single Photon Spectrum 

• 

 For this measurement, a pulsed light source is needed. This can be e.g. a pulsed LED or a pulsed laser. 

Connect the electrical trigger output of the pulser to the oscilloscope and set the trigger to it.

• 

 Note:

 In case a synchronized electrical trigger output is not provided by the pulser, a second SiPM Evaluation 

Kit can be used to generate the trigger signal. This second SiPM should be fully illuminated by the same optical 

pulse e.g. with an optical beam splitter. The other path for the single photon measurement can be attenuate 

e.g. with neutral density filters.

• 

 Measure the area respectively the charge of the SiPM signal in e.g. a 25 ns wide gate. The histogram of 

the measured charge is the single photon spectrum (cf. fig. 2).

• 

 Note:

 E.g. the relative gain, breakdown voltage and photo detection efficiency can be extracted.

3.3 Using the Full Dynamic Range

• 

 The amplified SiPM signal output and the Monitor output can be connected and used simultaneously. 

Typically for low light levels down to single photons, the measurement is done with the amplified out

-

put. For higher light levels, the preamplifier will saturate at 0.5 V signal amplitude. After this point, the 

Monitor output is measured. This allows to exploit the the full dynamic range of the SiPM.

Fig. 2  Example of a Single Photon Spectrum


Measured with PM3350 at 4 V overvoltage

SiPM Signal

Histogram

Laser Trigger

SiPM Signal

20 mV

/div

Coun

ts [a.u.]

5 ns/div

Integrated Charge [nVs]

End In

tegr

ation Ga

te

St

art In

tegr

ation Ga

te

pedes

tal

1 pe

2 pe

3 pe

4 pe

5 pe

6 pe

7 pe

8 pe

9 pe

10 pe

11 pe

12 pe

13 pe

14 pe

15 pe

16 pe

17 pe


www.aptechnologies.co.uk

AP 

Technologies Limited   The Coach House   Watery Lane   Bath   BA2 1RL


T:  +44 (0) 1225 780400    F:  +44 (0) 8701 266449    E:  info@aptechnologies.co.uk 

Summary of Contents for SiPM

Page 1: ...www ketek net info ketek net Hofer Str 3 81737 Munich Germany phone 49 89 673 467 70 fax 49 89 673 467 77 KETEK GmbH www aptechnologies co uk AP Technologies Limited The Coach House Watery Lane Bath BA2 1RL T 44 0 1225 780400 F 44 0 8701 266449 E info aptechnologies co uk ...

Page 2: ...easurements 4 3 1 Dark Count Spectrum 4 3 2 Single Photon Spectrum 4 3 3 Using the Full Dynamic Range 4 4 Measurements with Scintillator 5 4 1 Energy Spectrum 5 4 2 Coincidence Time Resolution 6 5 Appendix 7 5 1 Variant for Optical Bench Mount 7 5 2 SiPM Bias Source 7 SiPM Eval Kit www aptechnologies co uk AP Technologies Limited The Coach House Watery Lane Bath BA2 1RL T 44 0 1225 780400 F 44 0 8...

Page 3: ... An over view is shown in figure 1 Signal lines need to be be terminated with 50 Ω Preamplifier power 12V DC 150 mA Bias positive with max 40 V typical current limit 2 mA Signal connected to the preamplifier Note Signal corresponds to 90 of the SiPM signal Monitor connected to an oscilloscope 50 Ω DC Note Monitor corresponds to 10 of the SiPM signal Amplified Signal connected to an oscilloscope 50...

Page 4: ...ed by the same optical pulse e g with an optical beam splitter The other path for the single photon measurement can be attenuate e g with neutral density filters Measure the area respectively the charge of the SiPM signal in e g a 25 ns wide gate The histogram of the measured charge is the single photon spectrum cf fig 2 Note E g the relative gain breakdown voltage and photo detection efficiency c...

Page 5: ...ge released by the SiPM corresponding to the deposited energy in the scintillator Evaluation Kits can be ordered either with unmounted or premounted LYSO crystals on the SiPMs For PM11 1 2 x 1 2 mm active area LYSO with 1 2 x 1 2 x 4 0 mm For PM33 3 0 x 3 0 mm active area LYSO with 3 0 x 3 0 x 5 0 mm For PM66 6 0 x 6 0 mm active area LYSO with 5 0 x 5 0 x 5 0 mm 4 1 Energy Spectrum In analogy to s...

Page 6: ...he minimum between Compton edge and 511 keV photopeak to filter for the energy respectively coincident events The Coincidence Timing can then be measured by the time difference of both Amplified Signals The output of the coincidence logic triggers the measurement of the timestamps of both Amplified Signals Note Best timinig is achieved with a timing measurement close to the baseline Typically with...

Page 7: ... the Evaluation Kit 5 2 SiPM Bias Source As an addon to both Evaluation Kits a SiPM Bias Source is available cf fig 5 It offers an adjustable bias voltage from 20 to 40 V with either positive or negative polarity Current limit can be set to either 2 or 20 mA For full technical specifications please refer to the KETEK SiPM Bias Source Datasheet Fig 5 SiPM Evaluation Kit for Optical Bench Mount with...

Reviews: