Keysight N2791A/N2891A High-Voltage Differential Probes User Guide
23
N2891A Plots
Figure 13
Graph of dB (S21) + 40 dB frequency response when inputs driven in com-
mon mode (common mode rejection), 100:1 attenuation
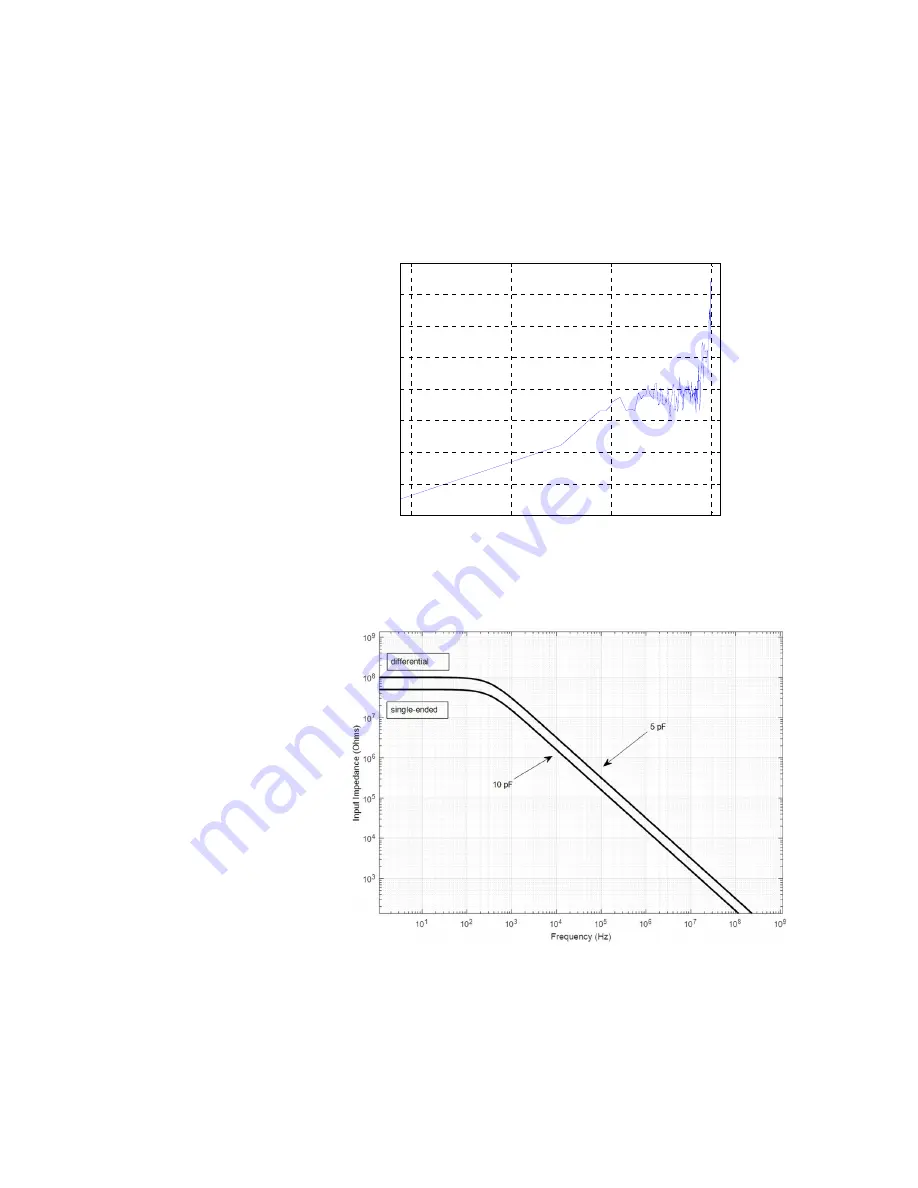
Figure 14
Magnitude plot of probe input impedance versus frequency, single-ended
10
2
10
4
10
6
10
8
-90
-80
-70
-60
-50
-40
-30
-20
-10
Frequency (Hz)
CM
RR
dB


