Scanner Maintenance and Calibration
5
Keysight 5500 SPM User’s Guide
5-16
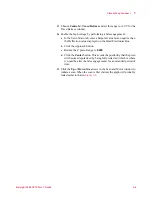
vertical cross-section through a line of features. Allow the scanner to
scan continuously, which will update the Cross Section plot each pass
through the frame.
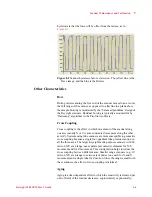
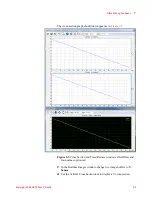
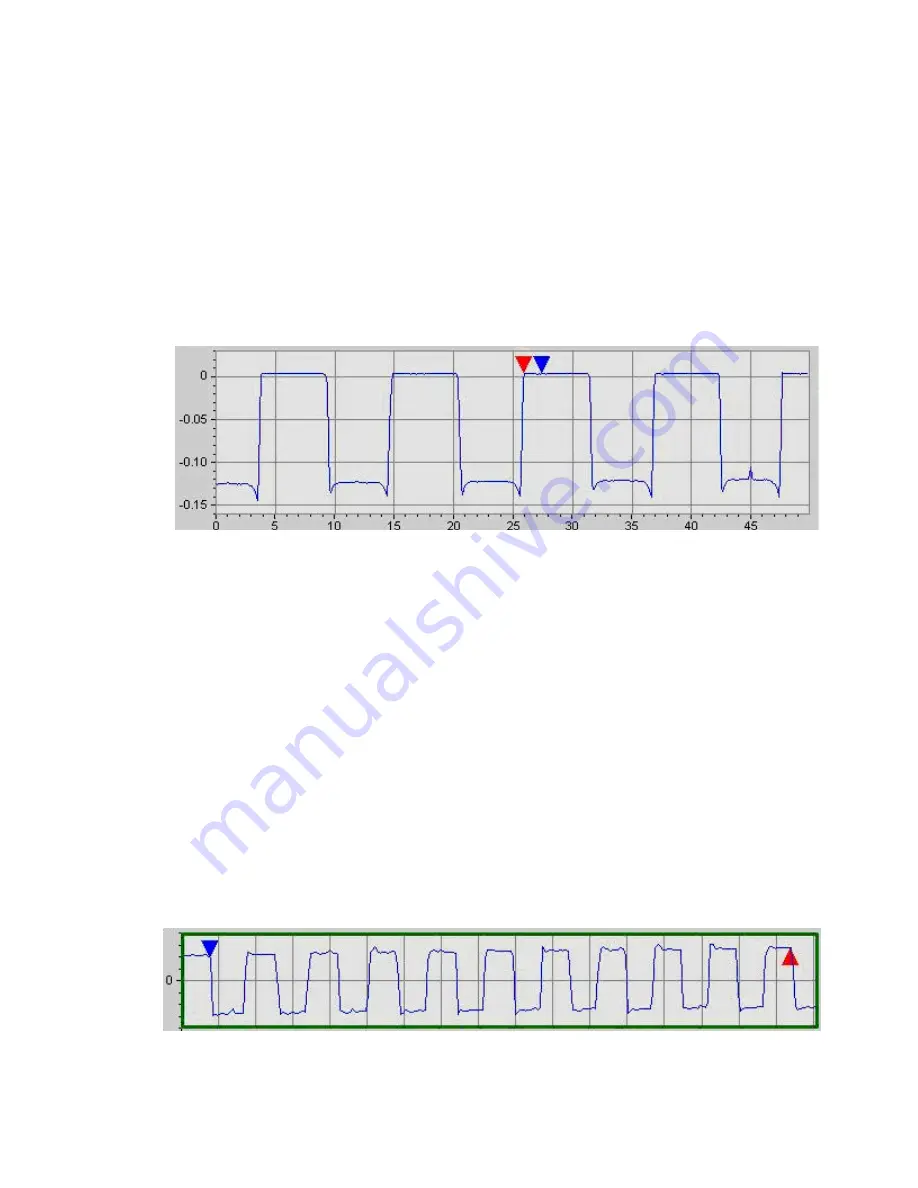
shows the upward scan (blue marker) and downward
re-trace (red marker) data. The markers are used to measure the
difference in the acquired data at a given point on the Y axis. The blue
marker was placed on the edge of a feature while the scan was moving
upwards. The red marker was placed on the same feature during the
downward scan.
Figure 8-13
Markers indicating trace and re-trace Y hysteresis
While scanning in one direction, focus on one step of the grating. As the
scan data is plotted, position a marker on this edge. Wait for the scan in
the opposite direction to occur and position a second marker on the
same edge after the plot has been updated. In the example below, about
2 microns of hysteresis can be measured using this method.
After increasing or decreasing the Y Hysteresis term, alignment of the
individual edges should be confirmed across the full range of the Y axis.
It may be necessary to update the hysteresis term more than once before
all edges become aligned in both the upward and downward scans.
Y Sensitivity
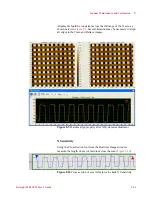
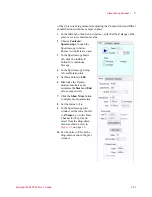
Using the Vertical Cross Section tool in the Realtime Images window
(from the Tools menu or Toolbar), measure the top-to-bottom distance
of a set of features across the scan (
).
Figure 8-14
Cross-section of several features to check Y sensitivity


