AVV-711 Quick Book
101
VIEW STATISTICS
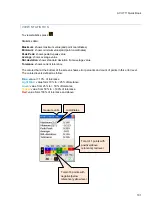
To view statistics press
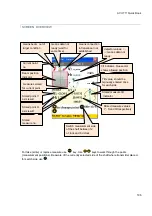
Statistics data:
Maximum
: shows maximum value(and point coordinates)
Minimum
: shows minimum value(and point coordinates)
Peak-Peak
: shows peak-to-peak value
Average
: shows average value
Std.deviation
: shows standard deviation from average value
Tolerance
: shows current tolerance
The colored bar at the bottom of the screen shows error percents and count of points in this error level.
The colored levels defined as follow:
Blue:
value <= 10% of tolerance
Light Blue
: value form 10% to < 25% of tolerance
Green
: value from 25% to < 50% of tolerance
Yellow
: value from 50% to < 100% of tolerance
Red
: value form 100% of tolerance and above
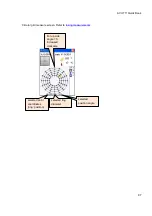
Total of 1 points with
positive(above
reference) red level
Total of 0 points with
negative(below
reference) yellow level
coordinates
measure units


