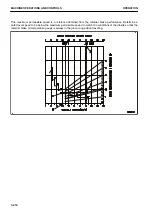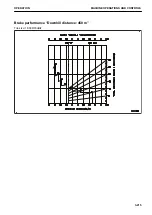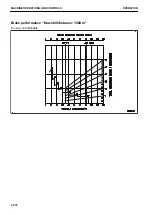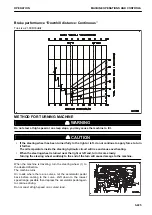
Brake performance “Downhill distance: Continuous”
Tire size: 18.00R33
★★
BRAKE PERFORMANCE CURVE: HD405-8
How to read the brake performance curve
Example) Downhill distance: 1500 m
Traveling resistance: –11 % (Grade resistance: –13 %, rolling resistance: 2 %)
Payload: 40 t
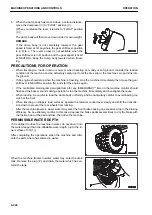
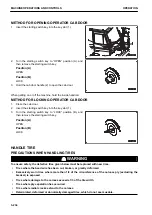
Obtain the maximum permissible speed and the gear speed range from the graph when traveling downhill under
the above conditions.
1.
Use the brake performance curve for downhill distance of 1500 m.
2.
Starting from the point (A) which corresponds to the gross machinery weight, draw a perpendicular line
down.
3.
Take the point where it crosses the line for traveling resistance -11 % as (B), and draw a horizontal line.
4.
Take the point where it crosses the performance curve as (C), and draw a perpendicular line down. Take
the point where this line crosses the travel speed scale as (D).
5.
The following information can be obtained from this procedure.
The maximum permissible speed is “28.7 km/h” from the point (D).
The gear speed is “F4” from the point (C).
OPERATION
MACHINE OPERATIONS AND CONTROLS
3-219
Summary of Contents for HD325-8
Page 2: ......
Page 13: ...FOREWORD INTRODUCTION 1 11 ...
Page 25: ...LOCATION OF SAFETY LABELS SAFETY SAFETY LABELS 2 3 ...
Page 26: ...SAFETY LABELS SAFETY 2 4 ...
Page 340: ......
Page 424: ......
Page 425: ...SPECIFICATIONS 5 1 ...
Page 429: ...ATTACHMENTS AND OP TIONS Before reading this chapter read and understand the SAFETY 6 1 ...
Page 447: ...REPLACEMENT PARTS 7 1 ...
Page 463: ......


