24
3.5.2
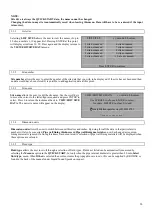
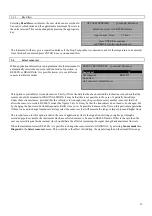
List block names /list block to view
The blocks of data will now appear in groups of 10. Press the
SCROLL key to find the block of data required. When the block
number is found, press enter to return to the DATA LOGGER menu.
Scroll down to Next block to view and enter the number selected
from the List block names option. When viewing data, the
instrument will go directly to the block of data selected, either when
viewing as text or graph.
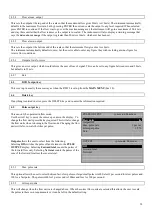
LIST BLOCKS yy-mm-dd hh:mm:ss
1.Pump room 6.xxxxxxxxxxxxxxx
2.Boiler House 7.xxxxxxxxxxxxxxx
3.xxxxxxxxxxx 8.xxxxxxxxxxxxxxx
4.xxxxxxxxxxx 9.xxxxxxxxxxxxxxx
5.xxxxxxxxxxx 10.xxxxxxxxxxxxxxx
SCROLL to continue, ENTER to exit
3.5.3
View log as text
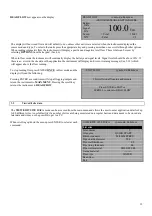
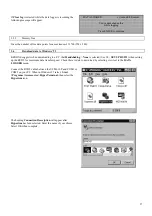
Text can be viewed in blocks, each having 240 data points. The display will list the text that has been logged from 0-240. It is
possible to scroll up and down the list using the scroll keys or by using keys 5 and 6, when the data will move in blocks of 60.
Each point is equivalent to the time the user has programmed into the instrument. i.e. if the instrument has been programmed to
read every 10 minutes, every data point will be equivalent to whatever the reading was at that time.
The message Error occurred appears on the display when there
is a signal loss or unstable flow conditions while logging. The
instrument cannot record what the error was under these
conditions.
MAIN MENU-LOG TEXT yy-mm-dd hh:mm:ss
Block: 1/ 1
(log name)
0
yy-mm-dd hh:mm:ss 100 l/m
1
yy-mm-dd hh:mm:ss
100 l/m
2
yy-mm-dd hh:mm:ss
Error occurred
3
yy-mm-dd hh:mm:ss
Error occurred
3.5.4
View log as graph
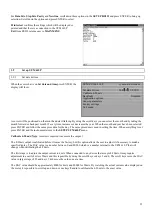
The logged data can also be viewed as a graph, in blocks or sections of data points. It is possible to view the flow rate and time
at any point on the graph, by moving the cursor along to that particular point. This can be done by pressing the scroll keys in the
direction you want the cursor to move. Keep the scroll key pressed for the cursor to move automatically. The flow rate and time
that appears in the bottom left hand corner of the display, relates directly to the position of the cursor.
MAIN MENU-PLOT GRAPH yy-mm-dd hh:mm:ss
Block: 1/ 1 +
Point: 60/120
(Log Name displayed here)
yy-mm-dd hh:mm:ss
333 l/m -
120
1
cursor

