10/2
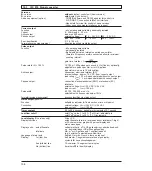
Error limits at reference conditions 10.2
Pulse output
± F Error in % of flowrate (actual value):
Curve A: DN 10 – 600 /
3
/
8
”- 24”
v
≥
0.4 m/s or v
≥
1.3 ft/s : ± 0.5 % of measured value
v
≥
0.4 m/s or v
≥
1.3 ft/s : ± 0.002 m/s or 0.0066 ft/s
Curve B: DN 700 – 1000 / 28” – 40”
v
≥
0.25 m/s or v
≥
0.8 ft/s : ± 0.8 % of measured value
v
≥
0.25 m/s or v
≥
0.8 ft/s : ± 0.002 m/s or 0.0066 ft/s
Q Actual flowrate
Q
F
Flow for error limit v
F
= 0.25 or 0.8 ft/s (see Flow tables)
v
Flow velocity in m/s and ft/s
v
F
Flow velocity in m/s and ft/s at Q
F
(see Flow tables)
Reference conditions
Product
Water, 10 to 30°C / 50 to 86°F
Electrical conductivity
> 300
µ
S/cm (
µ
mho/cm)
Power supply (line voltage)
U
N
(± 2%)
Ambient temperature
20 to 22°C / 68 to 71.6°F
Warm-up time
30 minutes
Straight inlet run
> 10
x
DN (DN = meter size)
Straight outlet run
> 3
x
DN
Primary heads
properly grounded and centered
Current output
same as above error limit for pulse output plus ...
0 to 20 mA:
± 0.05 % of full-scale range in each case
4 to 20 mA:
± 0.062 %
}
}
± F 3
%
2
1
0.8
0.5
0.25 0.4 0.5 0.75 1 10 11 12
(0.8) (1.3) (1.6) (2.4) (3.2) (33) (36) (40)
Q
F
Q
F
B
A
v
ms
(ft / sec)
}


