TECHNICAL DATA
8
107
OPTIWAVE 7300 C
www.krohne.com
04/2010 - 4000172403 - HB OPTIWAVE 7300 R05 en
8.3 Antenna selection
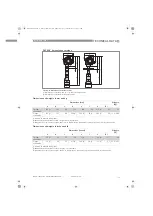
The graphs below show which antenna to select for the application based on:
•
D, the measuring range,
•
ε
r
, is the dielectric constant of the product being measured
Figure 8-2: Selection of antenna for liquid applications (graph of distance in m against
ε
r
)
Figure 8-3: Selection of antenna for liquid applications (graph of distance in ft against
ε
r
)
1
Distance, D [m]
2
Distance, D [ft]
3
Dielectric constant (
ε
r
) range for storage/stillwell applications
4
Dielectric constant (
ε
r
) range for process/agitator applications
5
DN80 or DN100 Horn antenna in a still well
6
DN80 or DN100 Horn antenna with or without a still well, or DN80 Drop antenna without a still well
7
DN40, DN50, DN80 or DN100 Horn antenna with or without a still well, DN80 Drop antenna without a still well or Hy-
gienic antenna
HB_OPTIWAVE7300_en_100430_4000172403_R05_D6B.book Page 107 Thursday, May 6, 2010 6:14 PM


