6 | Function description
The [Archive] tabulator
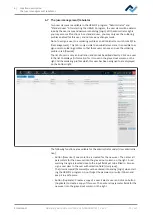
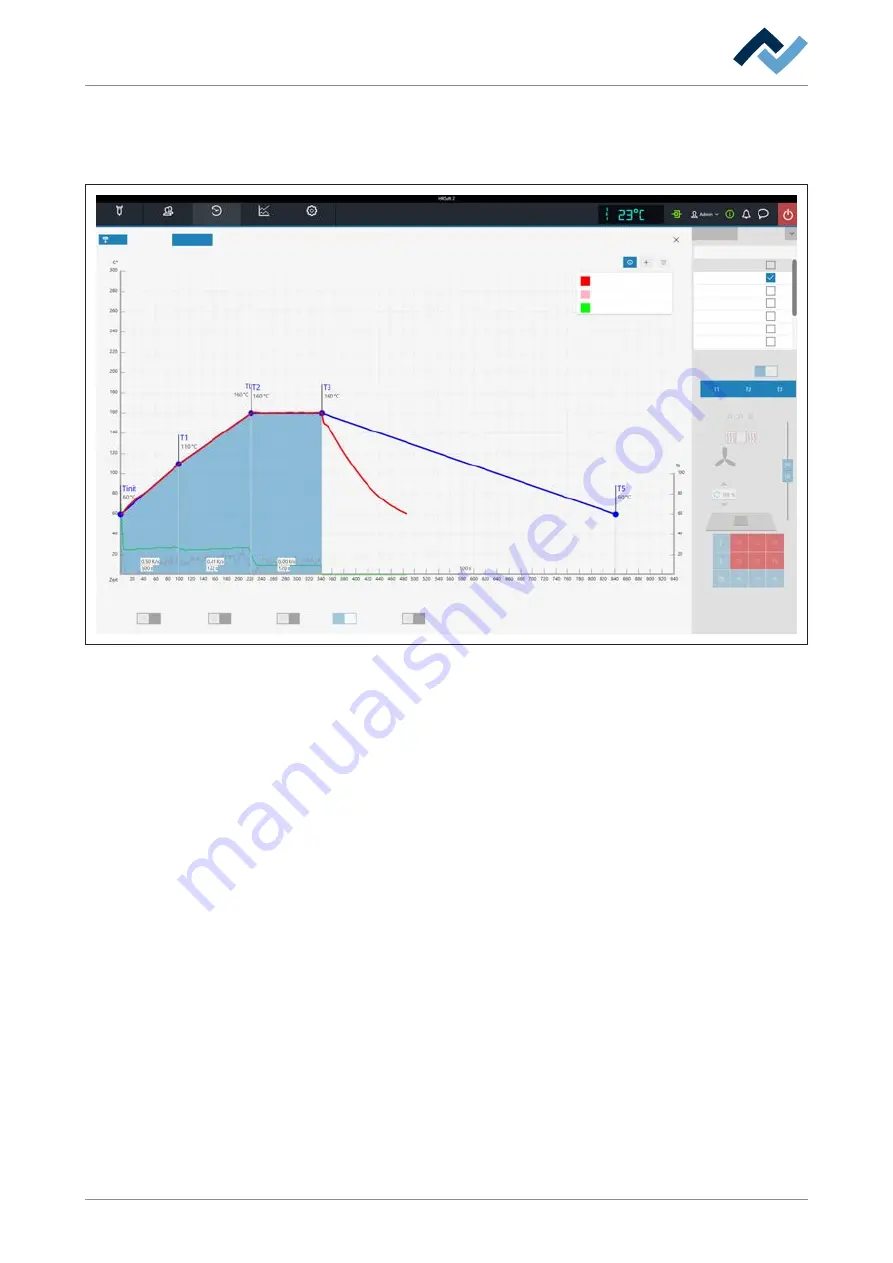
6.6.1 The [Show chart] button
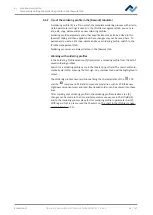
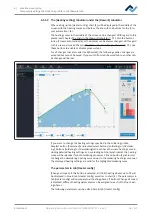
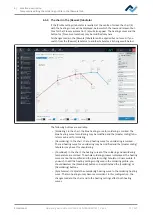
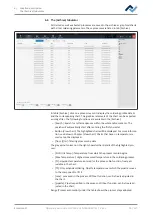
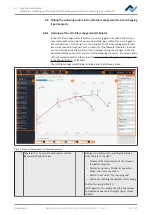
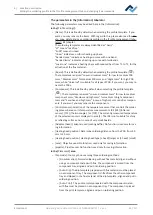
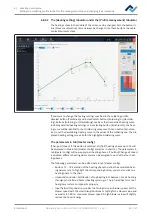
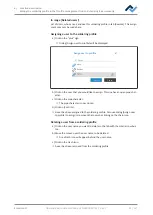
The archived chart of the highlighted soldering process can be called up via the
[View chart] button.
Style
Information
Soldering
Rework
Archive
User administration
Profile management
Administration
CSV export
Heater center bottom
Inner IR emitter
Sensor
Top
Desoldering
Placement
Inspection
Soldering
Inspection
Heater config
Show
IRS
TC1
TC2
TC3
TC4
TC5
Change all zones
Bottom
TC1
Process automation
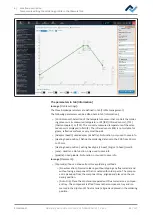
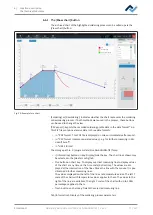
Fig. 20:
Example for a chart
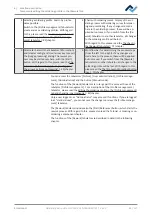
[Soldering] or [Desoldering]: Indicates whether the chart represents the soldering
or desoldering process. If both methods were used in the process, these buttons
can be used to change the view.
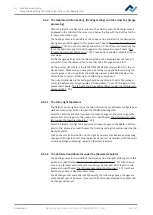
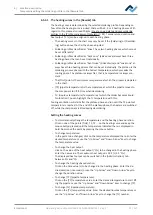
[CSV export]: Exports the recorded soldering profile data in the data format
*.zip
.
This ZIP file contains extensive data in three data formats:
– In *.PDF format. This PDF file is displayed on screen immediately after export.
– In *.CSV format (comma-separated values), e.g. for further processing in Mi-
crosoft Excel™.
– In *.HRS2 format.
The storage path is: C:\program data\Ersa GmbH\HRSoft2\Temp
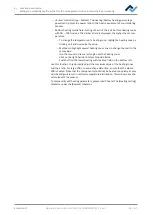
– i (Information) button on key: Display/hide the key. The chart lines shown may
be selected in the [Heater config] tab.
– Plus button on chart key: To display a vertical measuring line to display values
of the chart at any time on the time scale (X direction). The values are dis-
played at the intersection of the lines. Move the line with the mouse. It is pos-
sible to add further measuring lines.
The values displayed on the left of the line are temperature values. The left Y
scale of the chart with temperature values applies to them. The values to the
right of the line are variables. The right Y scale of the chart with up to 100%
percentages applies to them.
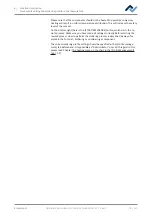
– Trash button on chart key: Delete the selected measuring line.
Tab [Information]: Display of the soldering process parameters.
Ersa GmbH
Operating instructions HR 550 XL EN 3BA00247-01 | Rev. 1
77 / 157

