background image


Chapter 7  - TV Measuring Range 

69 


106 V3.2 

7.2.2.4


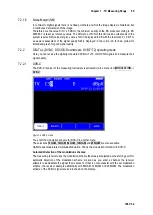
DVB-T2  

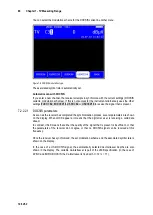
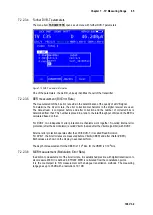
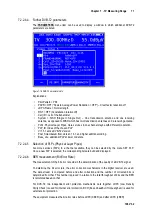
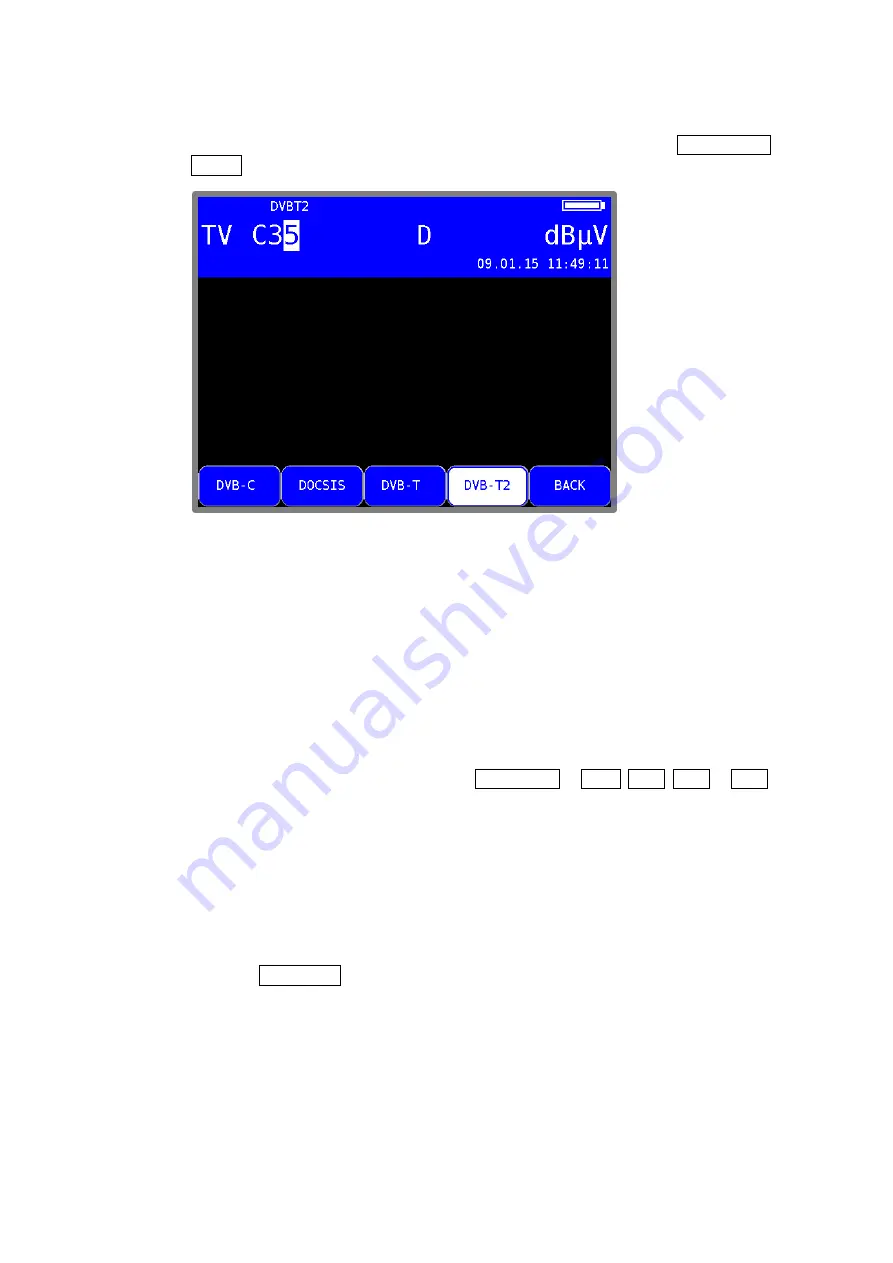
The DVB-T2 receiver of the measuring instrument is activated via the menu item 

MODULATION

 -> 

DVB-T2


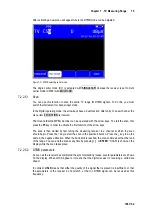
Figure 7-16 Modulation mode DVB-T2 

The modulation method for DVB-T2 is COFDM (Coded Orthogonal Frequency Division Multiplex). It 
involves a very robust digital transmission method that is  optimized in particular for transmission 

channels with multipath reception. DVB-T2 is a very flexible standard for terrestrial transmission of 

digital TV. OFDM transmission parameters can be optimally adapted to the topographic conditions. 

The  main  improvement  compared  to  DVB-T  is  a  higher  transmission  capacity  up  to  30%  at  the 

same channel quality.  


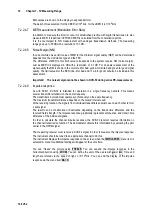
Selecting the COFDM bandwidth (channel bandwidth) 

7.2.2.4.1

The DVB-T2 standard provides for transmission in 1.7, 5, 6, 7 or 8 MHz channels.  
The bandwidths 1.7 MHz and 5 MHz are not supported by the instrument. 

 
The bandwidth of the COFDM signal is set via 

BANDWIDTH

 -> 

AUTO

8MHz

7MHz

 or 

6MHz

. In 

the  AUTO  setting,  which  is  also  the  default  setting,  the  measuring  instrument  uses  the  channel 

bandwidth that is stored in the respective channel table. 

This setting is non-volatile and is also incorporated in the tuning memory. 


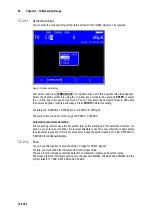
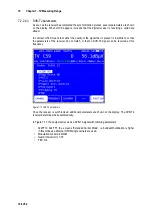
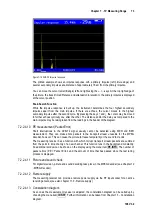
Scan 

7.2.2.4.2

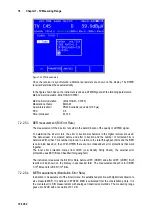
You can use this function to scan the entire TV range for DVB-T2 signals.  

To do this, you must switch the instrument to channel input mode. 

 
In the digital operating mode, the arrow keys have a dual function. After entry of a new channel, the 
menu item 

2.FUNCTION

 is inverted. 

 
That means that the MPEG decoder can be operated with the arrow keys. To start the scan, first 

press the F5 key in order to activate the first function of the arrow keys. 

The  scan  is  then  started  by  first  tuning  the  measuring  receiver  to  a  channel  at  which  the  scan 

should begin. Press the 

↑ 

key to start the scan in the positive direction. Press the 

↓ 

key to do the 

same in the negative direction. When the band limit is reached, the scan continues at the other end 

of  the  range.  You  can  end  the  scan  at  any  time  by  pressing 

ENTER

.  “SCAN”  is  shown  on  the 

display while the scan takes place.  


Summary of Contents for VAROS 106

Page 1: ...tion control 24 4 5 Switching on 24 4 6 Setting volume brightness contrast and color saturation 24 Menu structure 25 Chapter 5 5 1 Menu bar 25 5 2 Drop down menu 26 SAT Measuring Range 27 Chapter 6 6 1 Frequency input 27 IF input 27 6 1 1 RF input 27 6 1 2 6 1 2 1 Input of the oscillator frequencies 28 6 1 2 2 LO assignment 28 6 2 DVB S S2 operating mode 29 Selection of modulation 29 6 2 1 Symbol ...

Page 2: ... frequency and channel input 52 Channel input 52 7 1 1 Frequency input 52 7 1 2 7 2 Selecting of the operating mode 53 Analog ATV operating mode 53 7 2 1 7 2 1 1 Selecting the TV standard 53 7 2 1 2 Sound carrier 53 7 2 1 3 Scan 54 7 2 1 4 Picture and sound check 54 7 2 1 5 S N measurement 54 7 2 1 6 Noise Margin NM 55 DIGITAL DVB C DOCSIS Downstream DVB T T2 operating mode 55 7 2 2 7 2 2 1 DVB C ...

Page 3: ... 2 4 10 Picture and sound check 73 7 2 2 4 11 Remote supply 73 7 2 2 4 12 Constellation diagram 73 7 2 2 4 13 7 2 2 5 DTMB Option 74 Scan 75 7 2 2 5 1 DTMB parameters 75 7 2 2 5 2 BER measurement Bit Error Rate 76 7 2 2 5 3 MER measurement Modulation Error Rate 76 7 2 2 5 4 Noise Margin NM 77 7 2 2 5 5 Impulse response 77 7 2 2 5 6 PE measurement Packet Error 78 7 2 2 5 7 Picture and sound check 7...

Page 4: ...ntering the limit 94 11 6 Analysis of identifier 95 11 7 Measuring the interference field strength 95 11 8 Setting the identifier 95 11 9 Remote supply 96 Setting the remote supply voltage 96 11 9 1 Changing the fixed remote supply voltages 96 11 9 2 MPEG Decoder 97 Chapter 12 12 1 Program Service Information PSI 97 12 2 Network Information Table NIT 98 12 3 Logical Channel Numbering LCN List 99 1...

Page 5: ...16 4 Favorites list 120 16 5 Importing a SAT list 121 Optical Receiver 122 Chapter 17 17 1 Introduction 122 17 2 Activating the optical input 123 17 3 Setting the wavelength 123 17 4 Measuring the optical power 124 17 5 Measuring the optical modulation index OMI 124 17 6 Cleaning the fiber optic plug connection 125 17 7 USB Microscope 126 Operation 128 17 7 1 Logging 129 17 7 2 Management of the i...

Page 6: ...dule 144 23 2 Operation 144 23 3 Card menu 145 Wi Fi 146 Chapter 24 24 1 Introduction 146 24 2 Connecting antenna 146 24 3 Entering the WLAN Measurement Mode 146 24 4 MAC address of the wireless module 146 24 5 Measurement Capabilities 147 Channel allocation 147 24 5 1 Overview of all access points in the area 147 24 5 2 Level measurement of a single access point 148 24 5 3 24 6 Tips for WiFi rece...

Page 7: ... are applied to the measuring receiver s RF input since they may destroy the input circuits Do not cover the ventilation slots on the instrument Doing so can lead to reduced air circulation in the instrument causing heat to accumulate The electronic components can overheat as a result Important Depending on the operating mode and the ambient temperature overheating can occur when the instrument is...

Page 8: ...T telephones and GSM mobile phones can cause malfunctions and incorrect measurements if they are operated in the immediate vicinity of the measuring receiver 1 3 Maintenance The instrument is maintenance free 1 4 Cleaning Clean the case and the TFT display with a soft lint free dust cloth Never use solvents such as diluents for cellulose lacquers acetone or similar since they may damage plastic pa...

Page 9: ...olution 50 kHz DAB 170 250 MHz Resolution 50 kHz Wi Fi 802 11 b g n 2 412 2 472 MHz 802 11 a 5 180 5 700 MHz OPERATION Input Illuminated silicone keypad Monitor 5 7 TFT VGA resolution 640 x 480 User Prompting via OSD On Screen Display german english Audio reproduction Integrated stereo loudspeaker RF INPUT IEC socket 75 Ohm DIN 45 325 Return loss 12 dB 5 1 214 MHz all ranges except SAT 10 dB 910 2...

Page 10: ...Hz 1 MHz or 200 kHz depending on symbol rate FM 200 kHz RC 1 MHz 200 kHz or 90 kHz depending on bandwidth symbol rate setting EMI 200 kHz DAB 1 MHz Acoustic level trend indicator can be switched on off ANALYZER Measuring bandwidth SAT 8 MHz 4 MHz 1 MHz RBW 3dB TV 4 MHz 1 MHz 200 kHz 90 kHz FM 200 kHz 90 kHz DAB 1 MHz 200 kHz RC 200 kHz 90 kHz Span frequency segment SAT Total range 600 MHz 150 MHz ...

Page 11: ... packet errors since the start of measurement Automatic detection DVB S DVB S2 Scan function DVB S2 QPSK 8PSK demodulator 16APSK 32APSK per ETS 302307 Symbol rates 2 45 MSym s for 32APSK up to 38 MSym s Freqency offset df Resolution 0 1 MHz Measuring accuracy 100 kHz Measuring parameters per ETR 290 CBER before LDPC 1 00 10 8 LBER after LDPC 1 00 10 8 MER up to 20 dB Noise Margin NM up to 10 dB Re...

Page 12: ...espectively Decoding of MONO STEREO and dual sound broadcasts S N MEASURING On analog video signals evaluated measurement according to CCIR 569 Sources TV analog Measuring range 40 55 dB Noise Margin NM up to 10 dB Resolution 0 1 dB Measuring accuracy 1 5 dB DVB C AND EURO DOCSIS QAM demodulator per ETS 300163 Symbol rates 1 0 7 2 MSym s Modulation scheme 16 32 64 128 und 256 QAM Measuring paramet...

Page 13: ...packet errors since the start of measurement Scan function DVB T COFDM demodulator per ETS 300744 Bandwidth 6 7 8 MHz FFT 2k 8k Modulation scheme QPSK 16QAM 64QAM Guard intervals 1 4 1 8 1 16 1 32 Measuring parameters per ETR 290 CBER before Viterbi 1 00 10 6 VBER after Viterbi 1 00 10 8 MER up to 35 dB Noise Margin NM up to 10 dB Resolution 0 1 dB Measuring accuracy 1 5 dB PE Packet Errors up to ...

Page 14: ...mary impulse 0 40 dB Delay relative to the primary impulse in µs or km Scan function DTMB Demodulator per GB20600 2006 Bandwidth 8MHz Carrier mode Single carrier modulation C1 Multiple carrier modulation OFDM C3780 Modulation scheme 4QAM 4QAM_NR 16QAM 32QAM 64QAM Guard intervals PN420v PN595c PN945v PN420c PN945c FEC 0 4 0 6 0 8 Time interleave M_240 M_720 Measuring parameters per ETR 290 CBER bef...

Page 15: ...ters CBER before Viterbi 1 00 10 6 MER up to 25 dB Resolution 0 1 dB Measuring accuracy 1 5 dB DAB frame decoding per ETS TS 102563 Scan function TII evaluation MPEG 2 4 H AVS DECODER Display of MPEG video parameters Video bit rate measurement in Mbit s Video decoding MPEG 2 MP HL ISO IEC 13818 2 MPEG 4 AVC ISO IEC 14496 10 ITU T H 264 Option MPEG H L5 1 ISO IEC 23008 2 ITU T H 265 Option AVS AVS ...

Page 16: ...ut impedance 100 Ohm Difference output level typ 1 Vpp USB A USB A socket for data logger and software update USB 2 0 TUNING MEMORY Memory locations 200 Memory protection function ELECTRO MAGNETIC INTERFERENCE MEASUREMENT EMI Evaluation of the 13 digit identifier for the KFG 242 frequency identification generator and measurement of the interference field strength in connection with the bearing equ...

Page 17: ...35 dB Optical modulation index OMI individual OMI and total OMI Resolution 0 1 Measuring accuracy 10 of displayed value REMOTE SUPPLY Per RF input Voltage 5 20 V in 1V steps Power up to 500 mA short circuit proof 22kHz modulation SAT only 0 8 Vpp DiSEqC SAT only V1 0 V1 1 V1 2 V2 0 UNICABLE EN 50494 JESS EN 50607 Current measuring range 0 500 mA resolution 1 mA measuring accuracy 2 of final value ...

Page 18: ...ime approx 4 hours Battery management Battery can be charged using 12 V external supply ENVIRONMENTAL CONDITIONS Operating temperature 0 C 45 C Storage temperature 10 C 55 C Battery charging temperature 15 C 35 C ELECTROMAGNET COMPATIBILITY See Declaration of Conformity PROTECTION See Declaration of Conformity DIMENSIONS W H D 206mm x 297mm x 84mm WEIGHT Approx 2 5kg with battery pack QUANTITY OF ...

Page 19: ...Chapter 3 Control and connection elements pin configurations 19 106 V3 2 Control and connection elements pin configurations Chapter 3 3 1 Front panel Figure 3 1 Front panel ...

Page 20: ...20 Chapter 3 Control and connection elements pin configurations 106 V3 2 3 2 Rear panel Figure 3 2 Rear panel ...

Page 21: ...3 2 3 3 Top section of instrument Figure 3 3 Top section of instrument USB A socket 3 3 1 Pin 1 VCC 5V Pin 2 Data D Pin 3 Data D Pin 4 GND Figure 3 4 USB A socket RF Input 75 Ohm DVI D Digital Video output USB A port Wi Fi Antenna connector Optical input CAM PCMCIA slot ...

Page 22: ...2 According to DDWG Digital Display Working Group DVI Digital Visual Interface Revision 1 0 Figure 3 5 DVI socket 3 4 Bottom section of instrument Figure 3 6 Bottom section of instrument 12V power supply 3 4 1 Extra low voltage jack according to DIN 45 323 Figure 3 7 Extra low voltage jack ...

Page 23: ...ly when disassembling the instrument e g replacing batteries 4 2 Battery operation Replacing the Li Ion battery 4 2 1 The customer can replace the installed battery It is strongly recommended to only use original batteries from the manufacturer To replace the battery remove the three screws from the left side panel of the instrument and remove the side panel Unlock the battery plug using a screwdr...

Page 24: ...s not possible to charge the battery when the temperature is below 0 C 4 3 Operation using an external power supply In addition to using the battery you can run the device on external direct current supplied by the mains adapter or the cigarette lighter adapter in a vehicle for example Direct current is fed via the extra low voltage jack on the bottom section of the instrument The external voltage...

Page 25: ...menu using the menu items or Press BACK to go to the previous menu The menu items can be grouped into main and submenus Every measuring range has its own menu bar that is adapted to the respective operating mode To make operation easier the configuration of the range menu adjusts to the current operating status of the measuring receiver This means different menus are displayed when it is in the de...

Page 26: ...electing a menu point Select the desired menu item using the arrow keys or and press ENTER Back to previous menu level Press HOME key To change the page In an extended menu you can switch between sides with the arrow keys Figure 5 1 Default status with menu Figure 5 1 shows the instrument in default status of the DVB C range and the drop down menu for general settings Measuring parameter range Dro...

Page 27: ...corresponding minimum or maximum value After that the receiver is tuned and the actual measured values are displayed IF input 6 1 1 The figure above shows the default status for the entry of the SAT IF frequency The menu item RF is not activated Here you can enter in the range 910 2 150 MHz RF input 6 1 2 The instrument offers the option of directly entering the transponder frequency in GHz For th...

Page 28: ... set which oscillator frequencies are considered during RF input With MODE Settings LNB Frequencies LO Allocation a selection of Ku Standard Ku LO Low Ku LO High and C band appears The default setting is Ku standard During RF input the instrument switches automatically between Ku Low and Ku High The threshold for switching to the high band is 11 7 GHz After entry of the transponder frequency the i...

Page 29: ...t Automatic standard detection The measuring receiver uses the set standard as the starting point for automatic standard detection As soon as you enter a new frequency the receiver attempts to demodulate the signal that is present If it is not successful in the set standard a different modulation type is automatically used The standard of the signal received is shown on the display Symbol rate inp...

Page 30: ...put where you can set this Scan 6 2 3 You can use this function to scan the entire SAT frequency range 910 2 150 MHz for DVB S S2 signals Within the scan the DVB S S2 parameters or the set symbol rate plus the two first of the list above are used In the digital operating mode the arrow keys have a dual function After entry of a new frequency the menu item 2 FUNCTION appears in inverse That means t...

Page 31: ...played For DVB S2 the modulation scheme here 8PSK and the presence of pilots are also displayed Figure 6 5 SAT DVB S S2 parameters 6 2 4 1 Parameters in the MPEG area After the program search has been successfully completed see Chapter 12 MPEG Decoder the provider and the satellite position is shown in the upper right corner This information is extracted from the NIT Special receiver settings 6 2 ...

Page 32: ...er stopping the measurement using HOME BER measurement Bit Error Rate 6 2 6 The measurement of the bit error rate aids in the qualitative assessment of a DVB signal To determine the bit error rate the error correction mechanisms in the digital receiver are used The data stream is compared before and after correction and the number of corrected bits is determined from that This number is placed in ...

Page 33: ... in the transport stream unusable for the MPEG decoder however This can lead to short picture freezes or sound that crackles The extent of this depends largely on the receiver hardware The measuring receiver has a function with which corrupt transport stream packets are summed from the point in time of entry of a new frequency This function runs in the background continuously To active the display...

Page 34: ... set If DiSEqC is active press the LNB key the LNB menu is displayed You must first switch off the DiSEqC or UNICABLE control with DiSEqC OFF Then you can select one of the 4 SAT IF layers via menu item SAT IF Layer The current selection is then shown on the top line of the display Figure 6 7 SAT IF Layer Changing the fixed voltages 6 4 2 Two fixed voltages 14 V and 18 V are set ex works for the L...

Page 35: ...Chapter 6 SAT Measuring Range 35 106 V3 2 Figure 6 8 Change LNB voltage ...

Page 36: ...SEqC compatible components to be run when DiSEqC control is active Figure 6 10 DiSEqC menu 6 4 3 1 DiSEqC V1 0 control LNB DiSEqC V1 0 activates DiSEqC standard V1 0 This allows up to 4 satellite positions with up to 4 SAT IF layers each to be controlled You set a SAT IF layer using LNB IF Layer V Lo H Lo V Hi or H Hi You can set a satellite position using LNB Satellite P1 P4 P1 can then be used f...

Page 37: ... incorporates DiSEqC component cascading Therefore the commands must be repeated The number of repetitions selected should be as low as possible as otherwise unnecessary DiSEqC commands are sent slowing the control LNB Repeats allows you to select between 0 1 default 2 and 3 repetitions If you press ENTER the setting is accepted Figure 6 12 DiSEqC 1 1 control sequence with 1 repetition As already ...

Page 38: ...set the committed switches setting must be P4 V Hi Therefore you must make settings in all 4 DiSEqC1 1 submenus for the marked SAT IF route Set SAT IF layer to V Hi Set satellite position to P4 Set uncommitted switches to SW1 OFF und SW2 ON Set repetitions to 2 Afterwards the display should show P42 V Hi This setting connects the SAT IF route marked in bold type in the example All settings are inc...

Page 39: ...annot pass To do so proceed as follows First use the DRIVE function to move the motor to the position to be set as the western limit If you select the menu item Limit West the western limit will be stored in the rotating system Limits off This function allows you to override the eastern and western limits of the rotating system The motor can then travel to its mechanical limits again If you select...

Page 40: ...E EN 50494 6 4 4 UNICABLE satellite signal distribution over a single coaxial cable distribution network is a variant of the DiSEqC control and corresponds to the EN 50494 standard With this system the desired transponder is converted to a fixed frequency center frequency of the userband UB slot or band pass in the UNICABLE unit LNB or multi switch The information regarding which transponders shou...

Page 41: ... being used UB slots starts always with 1 SCR addresses starts from 0 so a SCR address 0 is a UB slot 1 The name of the bank can also be edited The user defined name for the bank appears in the menu for selecting the bank Figure 6 16 UNICABLE SCR ADR activate menu Change the settings of a UB slot LNB DiSEqC UNIC SCR ADR Select one of the UBs and press ENTER and the measuring receiver now operates ...

Page 42: ...s for moving the cursor to the desired position in the label With the numeric keypad you can enter or edit a name up to 20 digits in length Pressing the ENTER key closes the input menu is and stores the name in non volatile memory Entering of a startup time for the bank LNB DiSEqC UNIC SCR ADR Bank You can enter a time in ms which a connected multiswitch needs until it is ready after power up to p...

Page 43: ... 450 GHz via LNB LO Frequency The setting is also non volatile This setting is also additionally stored in the tuning memory The default setting is 10 200 GHz 6 4 4 2 Operation The UNICABLE control can be used to convert up to eight SAT IF levels in up to eight UB slots These are further divided into two satellite positions each with four SAT IF levels or two SAT IF levels in wideband mode Each co...

Page 44: ...le UNICABLE control is active open the LNB menu using the LNB scan SCR ADR Press ENTER the scan starts and took about 10s Then the determined UBs are shown along with their center frequencies After successful scan select one of the 8 items Transfer UBs to BANKx for saving the displayed frequencies in the non volatile memory of the bank selected and overwrites the existing frequencies 6 4 4 4 Progr...

Page 45: ...is etc To change the current configuration proceed as follows Select the Config write menu using the up and down keys Then press the key to access the following menu see Figure 6 21 Edit antenna wall outlet configuration The desired configuration can be set using the keys as well as the and keys Pressing ENTER programs this configuration and returns you to the original menu If the programming was ...

Page 46: ...nd center frequency Select the item edit in the menu above to open a submenu where you can set the UB center frequency that corresponds to the selected SCR address This is the frequency that a connected receiver needs to tune to Use the keys the and keys or the numeric keypad to set the UB center frequencies within the range from 950 MHz to 2 150 MHz Press ENTER to save the entry the menu with the...

Page 47: ...een the connected receivers during control If this situation arises when using the measuring receiver send the control command again by pressing the HOME and ENTER key combination Note In the JESS operating mode the scan function is deactivated In general JESS components are backwards compatible and can also understand conventional EN50494 commands If the expanded features of JESS are not required...

Page 48: ...48 Chapter 6 SAT Measuring Range 106 V3 2 6 4 5 4 Programming antenna wall outlet See chapter 6 4 4 4 Programming antenna wall outlets ...

Page 49: ...nd can displayed by the analyzer Figure 6 24 LNB menu JESS First the JESS Mode must be activated Selecting LNB CW tones on a CW tone at all available UBs is started and the device gets in the analyzer mode Figure 6 25 LNB Continuous Wave tones Note This feature is only available for devices according the EN50607 Using this other receivers on the same cable are impeded so it s only for service purp...

Page 50: ...But this programming is also possible by this measuring receiver with the DiSEqC Script function A set of DiSEqC commands according EN 50494 50607 can be easily edited in a common texteditor end saved with the ending dsq You can get appropriate files from the manufacturer e g JULTEC These files must be stored on an USB stick which can be connected to the measuring receiver The script function send...

Page 51: ...ole processing Further lines DiSEqC commands composed of hexadecimal figures and a blank between each 2 bytes A command have to start in the first column of a line and is terminated by a semicolon The rest of the line is treated as a comment A double backslash marks a comment An exception is the 18V codeword which must be written in an own line Thereby the LNB voltage is set to 18V to be confort f...

Page 52: ... channel table there are common channels C channels and special channels S channels You can switch the instrument from C to S channel input by pressing the F1 key CHANNEL You can enter the desired channel number using the numeric keypad or the arrow keys Invalid entries are ignored and the last valid channel number is shown again Frequency input 7 1 2 You can enter the frequency within a range of ...

Page 53: ...rd is also incorporated in the tuning memory The default setting is B G The TV standard that is currently set is shown in the top line of the display The channel table is also changed when the instrument is switched to another TV standard 7 2 1 2 Sound carrier Audio signals are transmitted on modulated sound carriers Depending on the TV standard the two sound carriers have different frequency dist...

Page 54: ...shown using the arrow keys 7 2 1 4 Picture and sound check As soon as the measuring receiver is tuned the TFT screen shows the demodulated video image At the same time the internal loudspeakers of the instrument outputs the demodulated audio signal Picture and audio reproduction are interrupted by using PRINT ore SAVE To restart reproduction use ENTER 7 2 1 5 S N measurement Figure 7 3 S N measure...

Page 55: ...eive the digitally modulated DVB C T T2 or DOCSIS signals and measure their signal quality 7 2 2 1 DVB C The DVB C receiver of the measuring instrument is activated via the menu item MODULATION DVB C Figure 7 4 DVB C mode You enter the modulation scheme for DVB C in another menu The selections 16QAM 32QAM 64QAM 128QAM and 256QAM are also available QAM means Quadrature Amplitude Modulation That is ...

Page 56: ...e symbol rate can be set in the range 1000 kBd to 7 200 kBd Automatic symbol rate detection The measuring receiver uses the set symbol rate as the starting point for automatic detection As soon as you enter a new channel the receiver attempts to use the set symbol rate to demodulate the signal that is present If this is not successful it uses the symbol rates 6 111 kBd 6 875 kBd or 6 900 kBd for a...

Page 57: ...stream In contrast UNLK means that either the quality of the signal that is present is insufficient or that the parameters of the receiver do not match or that no DVB C signal can be received at this frequency Once the receiver has synchronized the set modulation scheme and the associated symbol rate are shown on the display BER measurement Bit Error Rate 7 2 2 1 4 The measurement of the bit error...

Page 58: ...r good will also be included in this assessment PE measurement Packet Error 7 2 2 1 7 Short interruptions in the DVB C signal usually cannot be detected using MER and BER measurement They can make entire packets in the transport stream unusable for the MPEG decoder however This can lead to short picture freezes or sound that crackles The extent of this depends largely on the receiver hardware The ...

Page 59: ...y range 50 862 MHz 112 862 MHz As you can see in the comparison you can use a DVB C receiver for the reception of a Euro DOCSIS downstream signal It is only necessary to set the symbol rate to 6 952kBd For US DOCSIS a receiver according to ITU J 83 B is required The measuring receiver has a common receiver for both DOCSIS variants You can activate the DOCSIS receiver of the measuring instrument vi...

Page 60: ...eiver has completed the synchronization process several parameters are shown on the display When LOCK appears it means that the digital receiver is receiving a valid data stream In contrast UNLK means that either the quality of the signal that is present is insufficient or that the parameters of the receiver do not agree or that no DOCSIS signal can be received at this frequency Once the receiver ...

Page 61: ... This number is placed in a ratio to the total throughput of bits and the BER is calculated based on that With Euro DOCSIS there is only one error protection mechanism Reed Solomon That means that there is only one bit error rate BER here With US DOCSIS in contrast there is an internal error protection Viterbi and an external error protection Reed Solomon as same as in DVB S and DVB T For technica...

Page 62: ... see Chapter 13 Constellation diagram 7 2 2 3 DVB T The DVB T receiver of the measuring instrument is activated via the menu item MODULATION DVB T Figure 7 9 DVB T modulation The modulation method with DVB T is COFDM Coded Orthogonal Frequency Division Multiplex It involves a very robust digital transmission method that is optimized in particular for transmission channels with multipath reception ...

Page 63: ...T signals You must switch the instrument to channel input mode to use the scan function In the digital operating mode the arrow keys have a dual function After entry of a new channel the menu item 2 FUNCTION is inverted That means that the MPEG decoder can be operated with the arrow keys To start the scan first press the F5 key in order to activate the first function of the arrow keys The scan is ...

Page 64: ... Figure 7 11 shows transmission with the modulation scheme 16QAM The DVB T standard specified two FFT modes 2k or 8k In the top line you can see the currently determined FFT mode Additional parameters are the Guard Interval GI FEC Forward Error Correction and the network identification number ID These are displayed in the line above the menu bar The DVB T standard is suitable for transmission in s...

Page 65: ...lculated based on that For DVB T two independent error protection mechanisms work together So called internal error protection after the demodulator is called Viterbi named after the Viterbi algorithm with DVB T External error protection operates after that With DVB T it is called Reed Solomon For DVB T the bit error rates are measured before Viterbi CBER and after Viterbi VBER Both values are sho...

Page 66: ...ngle carriers COFDM individual carriers may occasionally be notably attenuated through superimposition Because information is distributed among all carriers with respect to time the DVB T system can process this to a certain degree without any problem However the impulse response can be used to detect this scenario before it causes problems in reception The basis for measuring the impulse response...

Page 67: ...e secondary impulses and their attenuation 21 dB in relation to the primary impulse is displayed Peak Search Function While the impulse response is built up the instrument determines the four highest secondary impulses apart from the main impulse If there are echoes the cursor moves to the highest secondary impulse after the second cycle By pressing the keys and the cursor may be moved to further ...

Page 68: ...ndow can be shown on the display using the menu item PE INFO The number of packet errors PE Packet Error and the amount of time that has passed since the last tuning process is displayed Press ENTER to close the window again Figure 7 15 DVB T packet error Picture and sound check 7 2 2 3 10 For digital television picture and sound decoding take place in the MPEG decoder For more see section Remote ...

Page 69: ...set via BANDWIDTH AUTO 8MHz 7MHz or 6MHz In the AUTO setting which is also the default setting the measuring instrument uses the channel bandwidth that is stored in the respective channel table This setting is non volatile and is also incorporated in the tuning memory Scan 7 2 2 4 2 You can use this function to scan the entire TV range for DVB T2 signals To do this you must switch the instrument t...

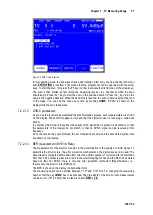
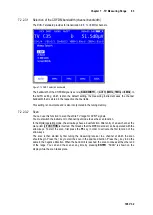
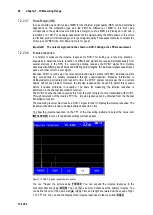
Page 70: ...ient or that the parameters of the receiver do not match or that no DVB T2 signal can be received at this frequency Figure 7 17 DVB T2 parameters Once the receiver is synchronized additional parameters are shown on the display The DVB T2 receiver determines these automatically In Figure 7 17 the equipment receives a DVB T2 signal with following parameters 32kFFTe 32k FFT the e means Extended Carri...

Page 71: ...e_Lite additional PLP at lower code rate Selection of PLPs Physical Layer Pipes 7 2 2 4 5 Are more services PLPs in a channel available they can be selected by the menu SET PLP Once a new PLP is selected the corresponding lists are build and displayed BER measurement Bit Error Rate 7 2 2 4 6 The measurement of the bit error rate aids in the determination of the quality of a DVB T2 signal To determ...

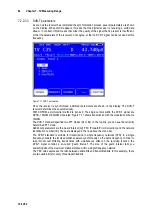
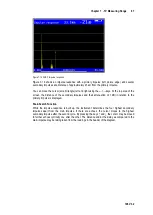
Page 72: ...2 is intended for operation in a single frequency network This means several transmitters transmit on the same frequency The transmitters involved must operate synchronously on the same frequency The maximum transmitter distance depends on the Guard Interval used At the receiving location the signals from individual transmitters superimpose on each other to form a sum signal The result can be cons...

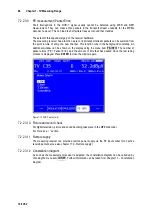
Page 73: ... interruptions in the DVB T2 signal usually cannot be detected using MER and BER measurement They can make entire packets in the transport stream unusable for the MPEG decoder however This can cause the picture to freeze temporarily or the sound to crackle The measuring receiver has a function with which corrupt transport stream packets are summed from the point in time of entry of a new channel T...

Page 74: ...rd ATSC and was further developed at the University of Shanghai Parts of the specification of DTMB which supports a single and a multi carrier mode are written down in GB20600 2006 Like DVB T2 DTMB uses for internal error correction the LDPC mechanism Low Density Parity Check and for external error correction the BCH mechanism Bose Chaudhuri Hocguenghem Thus the transmission standard is very robus...

Page 75: ... to activate the first function of the arrow keys The scan is then started by first tuning the measuring receiver to a channel at which the scan should begin Press the key to start the scan in the positive direction Press the key to do the same in the negative direction When the band limit is reached the scan continues at the other end of the range You can end the scan at any time by pressing or E...

Page 76: ...ion and the number of corrected bits is determined from that This number is placed in a ration to the total throughput of bits and the BER is calculated based on that With DTMB there are two independent error protections that work together The inner error protection comes from LDPC Low Density Parity Check the external error protection uses BCH Bose Chaudhuri Hocguenghem The instrument measures th...

Page 77: ...rument must receive a DTMB signal For this you must adjust the instrument to the appropriate channel By selecting the menu point IMPULSERES the instrument will show the impulse response on the display Simultaneously you will see a further menu for adjustments With FREEZE you can freeze the picture With ZOOM the impulse response can be spread horizontally You can define the unit of x axis with µs o...

Page 78: ...iver is adjusted the constellation diagram can be called up by choosing the menu item CONST Further information can be taken from Chapter 13 Constellation diagram Remote supply 7 2 2 5 10 The measuring receiver can provide a remote power supply via the RF input socket for an active receiving antenna see also chapter 11 9 Remote supply 7 3 Level measurement After the measuring receiver is tuned the...

Page 79: ... carrier level e g 13 0 dB 7 4 Diagrams For a clearer presentation of the measured values they may also be displayed as bar diagrams Operation 7 4 1 As soon as the instrument is adjusted it is possible to change to the diagram display by selecting the menu item DIAGRAM Thus the image display is stopped and the display of the program list is deleted The diagram display is terminated by calling up D...

Page 80: ...n set the parameters for the scan You can move the cursor to the individual entry fields using the keys You can specify the upper and lower limits for the scan entering the items Starting at and Stopping at The entire TV range can be used Using the F1 F4 soft keys you can select which signals to include in the scan To start the function move the cursor to START and then press the ENTER key In the ...

Page 81: ...igure 7 27 BlindScan export to XML file The CHA FILE menu item allows the list to be exported as a user defined channel list see Chapter User defined TV channel table18 7 User defined TV channel table The instrument numbers the channels consecutively starting with C1 This can be easily adjusted using the AMA Remote PC software This channel table can then be re imported into the instrument This is ...

Page 82: ... keypad or the arrow keys Here the smallest frequency resolution is 0 01 MHz 10 kHz You use the ENTER key to confirm the entry After that the receiver is tuned and the actual measured values are displayed Invalid entries are limited to the corresponding minimum or maximum value 8 2 Sound reproduction The measuring instrument s VHF stereo receiver demodulates a received VHF signal and reproduces th...

Page 83: ...h a maximum of 8 characters in groups 0A and 0B The program name e g Bayern 3 is shown in the top line of the display In addition to the program name the PI Program Identification code is shown in the top line of the display The PI code is used as unique identification of the radio programs 8 5 Scan You can use this function to scan the entire range 87 40 108 20 MHz for VHF broadcast signals You s...

Page 84: ... acoustic level trend signal can be switched on A sound signal is emitted from the loudspeaker Its frequency changes in proportion to the measured level When the level increases the frequency goes up and vice versa The sound signal can be switched on and off via the menu item ACOU LEVEL When the sound signal is switched on the menu item is displayed inverted ...

Page 85: ...r the arrow keys Here the smallest frequency resolution is 0 05 MHz 50 kHz You use the ENTER key to confirm the entry Invalid entries are limited to the corresponding minimum or maximum value 9 2 Level measurement As soon as the instrument is tuned to a frequency it begins to measure the level and displays the measured value in dBµV The measuring range is from 25 to 110 dBµV with a resolution of 0...

Page 86: ...t in certain short time slots Therefore the maximum level for a frequency may only be present for a short amount of time For this reason a max hold function can be switched on in the measuring instrument Here the maximum level is saved starting from the point in time of activation This indicator only changes when an even higher level exists temporarily This function can be switched on and off via ...

Page 87: ...es out a level correction in relation to the set channel bandwidth Figure 9 3 RC Setting channel bandwidth Using the menu item BANDWIDTH OFF you can switch off adjustment to the channel bandwidth Now the instrument measures with a measuring bandwidth of 1 MHz This setting should be implemented if a comb generator sinusoidal signal or a noise generator is used as the signal source This is also the ...

Page 88: ...0 1 DAB mode 10 1 Switching between frequency and channel input The instrument can be tuned by entering the channel center frequency or by entering the channel You can switch between modes using the menu items CHANNEL or FREQUENCY After selection the corresponding menu item is displayed inverted Frequency input 10 1 1 Using the numeric keypad you can enter a frequency between 170 00 and 250 00 MHz...

Page 89: ...row keys To start the scan first press the F5 key in order to activate the first function of the arrow keys The scan is then started by first tuning the measuring receiver to a channel at which the scan should begin Press the key to start the scan in the positive direction Press the key to do the same in the negative direction When the band limit is reached the scan continues at the other end of t...

Page 90: ...requency network This is unlike in DVB T where each station in a cluster transmits the same station ID 10 5 BER measurement Bit Error Rate The measurement of the bit error rate aids in the determination of the quality of a DAB signal To determine the bit error rate the error correction mechanisms in the digital receiver are used The data stream is compared before and after correction and the numbe...

Page 91: ...s is performed in a similar manner as for DVB see chapter 12 1 Program Service Information PSI The decoder lists the names of all audio programs contained in the ensemble Pure data streams are not included DAB programs receive an additional label If the list comprises multiple pages you can switch between pages of the program list using the and keys 10 8 MSC decoding and audio playback You can pla...

Page 92: ... the selected remote supply before switching on the remote supply Otherwise terminating resistors may be overloaded or active components may be destroyed Setting the remote supply 10 9 1 Press LNB to open the selection menu You may select from the available voltages 0V 5V 14V and 18V using the arrow keys and activate the supply by pressing ENTER Measuring the remote supply current 10 9 2 For this ...

Page 93: ...inciple of the procedure implemented in this measuring instrument for measuring electromagnetic interference is implemented by many major cable network operators and is fully compatible with their measuring procedures Basic information on measuring radiation and on the required measuring equipment can be found in application note AN002 Electro Magnetic Interference Measurement EMI This document is...

Page 94: ...factor that is entered governs the conversion of the level measured by the receiver in dBµV to the displayed field strength in dBµV m The following relationship applies E dBµV m L dBµV m Factor dB 11 4 Entering the distance The limits for observing the EMI are based on the norm distance of 3m to the outer wall of the building As it is not always possible to take a measurement from 3m away the inte...

Page 95: ... equivalent field strength The absolute field strength is displayed in dBµV m in a larger font The measuring range is from 3 103 dBµV m EMI 241 or 5 105 dBµV m EMI 240 with a resolution of 0 1 dBµV m At the same time the instrument calculates in connection with the current spacing reference field strength at a distance of 3 m to the building and displays it in a smaller font in the row above the m...

Page 96: ...rs may be overloaded or active components may be destroyed Setting the remote supply voltage 11 9 1 Press the LNB key to open a selection menu where you can choose between 0 V 5 V 14V and 18V default setting By using ENTER the voltage will be activated Changing the fixed remote supply voltages 11 9 2 Three fixed voltages 5 14 and 18 V are set ex works for the remote supply In order to adjust the v...

Page 97: ...an be transmitted in the transport stream provide information about the programs being broadcast or about data services The receiver must first analyses the PSI tables in order to provide the user with an overview in the form of program lists This process can last a few seconds depending on the number of programs and can be viewed in the MPEG area of the display Figure 12 1 DVB C PSI information I...

Page 98: ...ich the receiver is currently tuned is marked with in the NIT You can now select a different entry using the key By pressing the ENTER key you get a menu displaying more details about the chosen channel including the Transport Stream ID the Original Network ID and the NIT Version Figure 12 3 NIT Details at DVB_T Channel The receiver can be tuned to the new transponder or channel by pressing the EN...

Page 99: ... in places such as hotels or hospitals in order to ensure that the memory locations are identical for all receivers To evaluate the LCN the device has to be locked on a digital service By selecting MODE LCN the evaluation of LCN starts If no NIT was evaluated before it starts with evaluation of the NIT first and then shows the sorted LCN List Figure 12 4 LCN LIST Per page 8 entries are displayed U...

Page 100: ...r detailed information about this program This information includes the program name provider Service ID Transport Stream ID Original Network ID and the PIDs packet identifiers for the elementary text streams involved Many programs are broadcast with multiple audio streams e g several languages The desired audio channel can be selected in the program details menu Start the program by pressing ENTE...

Page 101: ... is 1 second 12 7 Dynamic program switching Some program providers split their broadcast into regional content at specific times This means that for example 4 programs may appear in the MPEG program list which has the same content at certain times and different content at other times The program map table PMT in the data stream therefore changes over time In this way the station can prompt the rec...

Page 102: ... states the tips of the sum vectors result in an image of the deviation from the ideal state The worse the signal quality the larger is the distribution in the two dimensional state space The form of the constellation diagram makes it possible to draw conclusions as to the type of signal disturbance as will be explained later by means of examples The middle between two ideal states is called the d...

Page 103: ...tions Figure 13 1 Constellation diagram DVB T2 zoom By selecting the menu item FREEZE the diagram can be frozen By selecting ZOOM another menu appears in which each individual quadrant of the constellation diagram can be enlarged to the full size of the constellation diagram display area The screen layout in the ZOOM mode is a bit slower than in the full screen mode due to the serial reading of th...

Page 104: ...agram with phase jitter Error phase jitter The carrier is subjected to a low frequency frequency modulation Cause Defect or not correctly adjusted QAM modulator Figure 13 4 Constellation diagram with noisy signal Error noisy signal Cause bad C N the level is possibly too low ...

Page 105: ...Chapter 13 Constellation diagram 105 106 V3 2 Figure 13 5 Real constellation diagram DVB T2 Figure 13 6 DTMB constellation diagram ...

Page 106: ...r memory location between 0 199 can naturally be selected using the keypad The content of the memory location is displayed after each the memory number Press SAVE or ENTER to save The instrument issues a warning if the desired memory location is already occupied If you want to overwrite the memory location press ENTER or SAVE again 14 2 Recalling Press RECALL to open the RECALL menu The instrument...

Page 107: ...an the entire tuning memory according to different criteria According to A D mode The memory is sorted according to analogue and digital memory locations This can be accessed via MODE Memory Sorting memory according A D mode According to frequency The memory is sorted here according to ascending frequency You can access this function by pressing MODE Memory Sorting memory according frequency Accor...

Page 108: ... is identical to the MEM file name If a file with the same name already exists you will receive a warning A different name can be entered by pressing HOME or by pressing ENTER to overwrite the existing file The next section explains how to import the tuning memory Importing the memory 14 3 7 This function can be used to import a tuning memory saved on a USB data carrier in MEM file format into the...

Page 109: ...equency The blue region at the top of the screen contents date and time the frequency and level of the actual cursor position and the remaining battery capacity Pressing one of the five function Keys F1 F5 shows the menu item bar for some seconds 15 1 Accessing the analyzer Press the ANALYZ key in the currently active measuring range TV FM to access the analyzer The status of the measuring receive...

Page 110: ...requency is shown in the upper center of the screen TV range in the channel input mode Here you can move the cursor in the channel grid The measuring receiver also detects whether the channels are analogue or digital With analogue channels the cursor jumps to the video carrier frequency with digital channels the cursor expands to a window that corresponds to the channel bandwidth The channel bandw...

Page 111: ...nalog channels the level is based on the peak value of the video carrier With digital channels the total power within the channel bandwidth is measured It is not important here which SPAN is set 15 8 Progress bar A yellow bar on the lower edge of the screen grows from left to right during each new search by the analyzer This allows you to follow the position of the sweep 15 9 Level diagram in the ...

Page 112: ...upon which the two cursors are located are occupied the device draws a reference line between the peaks of the level lines To facilitate a tilt analysis in a system with both analog and digital channels an offset line corresponding to the level reduction is added to the peaks of the level lines for digital channels If the difference in level between an analog and a digital channel corresponds to t...

Page 113: ... RED the level reduction for digital channels can be set depending on the modulation scheme Figure 15 5 TILT measurement digital level reduction You can use the keys to select the desired entry field and open the input mask by pressing ENTER You can now change the value using the numeric keypad or the arrow keys Confirm every entry using the ENTER key The cursor then jumps to the next field and th...

Page 114: ...rs in the diagram instead of the level line When you activate a channel the small light blue X will disappear and the corresponding level line will only be updated when the analyzer is next run Activate all channels The menu item ACT ALL includes all channels in the measurement All light blue Xs in the diagram disappear However the level lines won t be shown before the next analyzer run has been u...

Page 115: ...In the ranges FM and RK direct switching is only possible in the lower spans not FULLSPAN At TV is possible in channel mode only but in every span Press ENTER to trigger the process SAT range 15 11 1 When the UNICABLE control is active the frequency display always refers to the spectrum that was converted by the UNICABLE unit Additional functions With MODE you get a menu to select between SAT SCAN...

Page 116: ...ia the menu item MAX HOLD The menu item is then displayed inverted The spectrum is only updated when the level increases Since with an active return path the spectrum changes depending on the activity of the connected cable modem a reasonable representation of the spectrum is only possible with this function Figure 15 7 Spectrum analyzer Max Hold function This function can also be called upon in d...

Page 117: ...consequence is that the required data rates in interactive cable networks can no longer be maintained It is therefore crucial to keep ingress as low as possible To support ingress measurement the instrument provides a special function Figure 15 8 Spectrum analyzer Ingress measurement The frequency range from 5 to 65 MHz is divided into 4 ranges Within these ranges the maximum level and the frequen...

Page 118: ... the function SAT SCAN or TRANSPONDER SCAN Figure 16 1 SAT SCAN menu 16 1 SAT SCAN This function can be chosen from the displayed menu described above or immediately using the soft key F5 SAT SCAN A search cycle starts in a range from east to west where the most important satellites are tuned to its transponders A separate window opens and show the actual searching status If the satellite system c...

Page 119: ...ce only these levels are searched The relevant data can be found in the document which accompanies the SAT list 16 2 SAT list Open the SAT list by pressing MODE Satlist SAT List if device is in default state Use the and keys to browse through the list pages Individual satellites can be selected using the and keys Pressing the ENTER button displays the transponder list for the selected satellite Fi...

Page 120: ...6 4 Favorites list You can save frequently required satellites in a favorites list so that they can be found more quickly To do so select the corresponding satellite from the SAT list and press SAVE The following menu appears Figure 16 5 Favorites list You can now select the position in the favorites list Pressing SAVE again saves the item as a favorite and the SAT list is displayed again The favo...

Page 121: ...ct a USB memory device with the downloaded corresponding file First of all the device should be in range SAT and in default state Using MODE Satlist to open the selection where you can choose Import Satlist Press ENTER to call up all of the sat files stored on the memory device Select and import the desired list by pressing ENTER This action overwrites the existing list on the instrument ...

Page 122: ...t has a somewhat worse return loss Connectors with APC angled physical contact have an interface with an angle of 8 PC connectors have blue markings whereas APC connections have green ones Fiber optic plug connections are available in various forms such as FC threaded connection SC plug connection and E2000 and LC both with snap plug connection An SC APC plug connection is built into the measuring...

Page 123: ...0 dB should be connected between the transmitter and the receiver to determine the signal quality 17 2 Activating the optical input You can activate the instruments optical input using RANGE FIBRE IN Figure 17 1 Optical input If the instrument s optical input is activated FIB XXXXnm will appear in the display XXXXnm stands for the wavelength set e g 1 310 nm Now you can set a specific measuring ra...

Page 124: ...is selectively measuring the OMI for a specific This measurement only takes the RF power within the channel bandwidth into account The total OMI measurement or OMI sum takes the entire RF power after the optical receiver into account For this purpose the instrument measures the average RF power after the optical receiver in the range from 5 to 2 150 MHz Signals outside of this frequency range are ...

Page 125: ...th the same optical power the RF voltage after the optical receiver increases by 6dB This means that the OMI and RF voltage are linearly proportional to one another 17 6 Cleaning the fiber optic plug connection The weak point of every optical transmission system lies in the splice and plug connections For plug connections it is important to ensure that the contact surfaces are very clean But the f...

Page 126: ...de dust particles hand lotion skin and alcohol residues Figure 17 4 typical contamination on the optical fibers Contamination on the optical fibers can cause the following problems the signal path can be disrupted in the core region good physical contact can be prevented in the plug connector cause scratches and associated damage The following figure shows a typical example of a poor physical cont...

Page 127: ...th Lightel DI 1000 USB microscope with an optical magnification of 200 The core of the optical fiber is visible in the center Figure 17 6 Microscope zooming Typical requirements for single mode fibers Zone name diameter Scratches Damage A Core 0 9 µm 0 25 µm Non permitted Non permitted B Cladding 25 120 µm No limits all 2 µm 5 in 2 5 µm range None 5 µm C Adhesive 120 130 µm No limits No limits D C...

Page 128: ...A 5 White Balance WHITE 100 WHITE 100 Gain GAIN GAIN The microscope s default settings can be loaded by pressing the DEFAULT button located near the F buttons As the manufacturer s settings are not always ideal you can permanently save the currently set values in the measuring instrument by selecting the SAVE button You can load these values again any time by selecting the RECALL button The USB mi...

Page 129: ...reenshot saving The screen message changes to Screenshot saved as soon as the image is saved The message No buffer free appears if no more space is free in the buffer All storage locations must first be saved to a USB stick See the following point Saving buffer images to a USB stick Switch to the TV range by pressing the HOME or RANGE button Unplug the USB microscope and connect a USB memory stick...

Page 130: ...py it from a computer onto the included USB stick Important It is highly recommended to plug the instrument to mains before updating the firmware Do not switch off the instrument while update is in progress Next insert the USB stick into the instrument and select MODE Settings Software Update A selection appears containing all saved bin files Select the desired file using the arrow keys Up Down an...

Page 131: ...available Select this item and use ENTER to set the clock 18 5 Serial number The serial number can be found on the name plate on the back of the instrument It can also be requested on the device using MODE Settings Serial number 18 6 Factory settings Use the PRESET function MODE Settings Factory settings to reset all instrument settings to the factory default settings The content of the tuning mem...

Page 132: ...rom which the most recently loaded channel table originates The loaded channel table is switched on off by pressing MODE Settings User Channellist activate This option is not available if a channel table has not been loaded If the user defined table is enabled the suffix USER is shown below in the menu bar in the menu item CHANNEL The table is now used for all functions based on a channel table Th...

Page 133: ...mory stick Press MODE Select Export Screenshots USB Depending on the number of occupied storage locations corresponding files are generated with the file name MICROSCOPE_xx BMP for microscope images or HARDCOPY_xx BMP for all other screen copies xx represents a consecutive number Files already saved on the USB memory stick are not overwritten The message Screenshots transferred memory locations cl...

Page 134: ... the manufacturer MODE Settings SoftwareKeys appears a submenu which contains the options available currently e g DVB T DVB T2 UMS To unlock an option confirm the menu item with ENTER An entry field for the 8 digit key code is then displayed Figure 18 4 Activating software options If the code is entered correctly the following message appears Option activated Now the corresponding option is enable...

Page 135: ...A different name can be entered by pressing HOME or by pressing ENTER to overwrite the existing file After this enter the individual measurement parameters The instrument now refers to the tuning memory whereby only the first and last memory locations must be entered for the measurements Any blank storage positions are skipped After this the instrument automatically accesses the tuning memory loca...

Page 136: ...asurements in MSExcel Figure 19 2 Evaluating DataLogger results in Excel 19 3 Deleting a series of measurements from the instrument If a USB stick has been inserted into the instrument choose MODE DataLogger Directory to access a list of files already saved on the stick The free memory capacity of the USB stick can also be read in percent For example the file shown above needs 18 kByte on the USB ...

Page 137: ...wnstream capacity utilization USDOCSIS Level MER VBER PE Packet Errors DF Duty Factor Downstream capacity utilization DVB T Level MER CBER PE Packet Errors DVB T2 Level MER CBER PE Packet Errors DTMB Level MER CBER PE Packet Errors FM Level RC Level DAB Pegel MER CBER If the optical input is activated the optical power trend is recorded instead of the level Note on recording the duty factor Before...

Page 138: ...he measuring instrument must be in the tuned mode measuring mode when the DataGrabber function is started The following submenu opens when the DATAGRABB menu item is called up Figure 20 1 DataGrabber configuration of measurement time This is where you specify the recording time period You can use the Up Down keys to select the desired entry field and open the input mask by pressing ENTER You can s...

Page 139: ... the specified time period has elapsed This only stops the recording Data that was recorded up until this point remains saved on the graphics screen If the instrument reaches the end of the recording process normally i e without being interrupted a beep sounds and the screen like in the next message Figure 20 3 Datagrabber recording finished The RESTART menu item allows you to initiate a new recor...

Page 140: ...rabber recording packed errors The level MER BER and packet errors relative are recorded for the DVB C mode The start time and time at which recording ended normally appear in the lower left and lower right of the display respectively The cursor time is marked with a The measured value at the cursor position is displayed above each diagram In the above example 46 packet errors occurred at 09 38 54...

Page 141: ...ore the instrument is switched over When the instrument is switched off and restarted the picture is shown again on the internal display Figure 21 1 DVI output selection menu DVI stands for Digital Visual Interface HDMI means High Definition Multimedia Interface Physically the interface is designed as a DVI I socket However the protocol is HDMI compliant This means that both video and audio data a...

Page 142: ...e decoder with full resolution in the formats 1280x720p50Hz 1920x1080p50Hz 3840x2160p25Hz and 3840x2160p30Hz via MODE Video output DVI internal Figure 21 2 Video resolution at HDTV via DVI menu In this case the live picture on the internal display has to be stopped There is an according note on the OSD about the video output to DVI Figure 21 3 Note during HDTV via DVI Via MODE Video output DVI int...

Page 143: ...cification in high speed mode The measuring instrument only supports the MASS STORAGE DEVICE class USB stick and some USB Microscopes The measuring receiver software can read files from and write files to a USB stick using the FAT32 file system A USB stick is used to carry out firmware updates or to record measurement data DataLogger Screenshots We recommend using the original USB stick from the i...

Page 144: ...module into the port at the top section of the instrument When inserting the module ensure that the polarity is correct and that the barcode is pointing to the rear Do not force the module into the slot if there is significant resistance Figure 23 1 Inserting a CA module 23 2 Operation The inserted module is initialized when the instrument is cold started Use the Common Interface menu to query the...

Page 145: ...ch module For example smartcard information software version software update PIN code entry for youth protection and so on The menu is laid out just like the other menus on the instrument The text and menu items come from the CAM itself however The language is also defined by the module The picture below shows the card menu of an AlphaCrypt CAM Figure 23 2 Card menu ...

Page 146: ...a To perform wireless measurements supplied Wi Fi antenna must be connected to the meter For this screw the antenna on the WLAN designated SMA jack at the top of the device 24 3 Entering the WLAN Measurement Mode The function key RANGE invokes the range change menu the respective areas are listed above the function keys F1 to F5 With RANGE WiFi can be changed in the wireless measurement mode The w...

Page 147: ...smitting on the channel Use the cursor keys to switch between the individual channels With the function key START SCAN a renewed single scan started for new access points Figure 24 1 Wi Fi channel diagram Overview of all access points in the area 24 5 2 In the main menu all access points found are displayed with their respective level channel and encryption The order is sorted by the reception lev...

Page 148: ...esentation of the respective space If an accesspoint using no secured connections then it is not necessary to select a specific password memory location After selecting the appropriate password space a connection to the access point can be started For this use the cursor keys and to select the appropriate access point and then press the function key CONNECT Upon successful connection the picture c...

Page 149: ...nal Rig walls also have a high attenuation factor that is important to consider if you plan to place the router in the attic Make attention to hidden barriers metal cupboards wall shutters metal shelves in the neighboring room steel roolcontainers under the desk all these objects creates a signal shadow wich can lead to larger WiFi holes Older cordless phones and older DECT models can massively di...

Page 150: ...6 16 UNICABLE SCR ADR activate menu 41 Figure 6 17 UNICABLE SCR ADR edit center frequency 41 Figure 6 18 Entering a startup time for Unicable devices 42 Figure 6 19 UNICABLE LNB menu 44 Figure 6 20 Antanna wall outlet configurator 45 Figure 6 21 Edit antenna wall outlet configuration 45 Figure 6 22 Jess UB selection 46 Figure 6 23 JESS Reading UB slots frequencies from CSS 47 Figure 6 24 LNB menu ...

Page 151: ...stellation diagram DVB T2 105 Figure 13 6 DTMB constellation diagram 105 Figure 14 1 Memory management 106 Figure 14 2 Memory management menu options 108 Figure 15 1 Spectrum analyzer 109 Figure 15 2 Spectrum analyzer selection of bandwidth 110 Figure 15 3 Level diagram 111 Figure 15 4 TILT measurement 112 Figure 15 5 TILT measurement digital level reduction 113 Figure 15 6 TILT measurement Select...

Page 152: ... output selection menu 141 Figure 21 2 Video resolution at HDTV via DVI menu 142 Figure 21 3 Note during HDTV via DVI 142 Figure 23 1 Inserting a CA module 144 Figure 23 2 Card menu 145 Figure 24 1 Wi Fi channel diagram 147 Figure 24 2 Wi Fi accesspoint list 148 Figure 24 3 Wi Fi level histogram graph 148 ...

Reviews: