Chapter 7 - TV Measuring Range
77
106 V3.2
Noise Margin (NM)
7.2.2.5.5
In case of white noise a limit value of MER for the minimum signal quality (QEF) can be determined
dependent on the modulation type, the FEC and the other parameters.
The difference of MER to this limit value corresponds to the system reserve NM (noise margin).
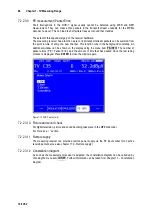
Just as MER it is displayed in dB with a resolution of 0.1 dB. For an easier assessment of the
signal quality the NM is shown in the colors red for bad, yellow for limited and green for good signal
quality. The limit values for the BER (>2e-4 for bad and <1e-6 for good) will also be included in this
assessment. This assessment also considers the limit value of LBER (>1e-7 for bad).
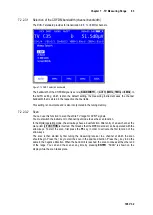
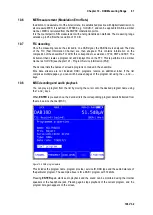
Important! The noise margin cannot be shown in DTMB during active PE-measurement.
Impulse response
7.2.2.5.6
For the measurement of the impulse response, the measuring instrument must receive a DTMB
signal. For this, you must adjust the instrument to the appropriate channel.
By selecting the menu point
IMPULSERES
the instrument will show the impulse response on the
display. Simultaneously you will see a further menu for adjustments.
With
FREEZE
you can "freeze" the picture. With
ZOOM
the impulse response can be spread
horizontally. You can define the unit of x-axis with
µs
or
km
. Time and length values are related
via the speed of light c:=3•10
8
m/s. Via the menu point
BACK
you can end the display of the
impulse response.
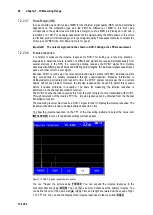
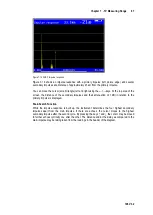
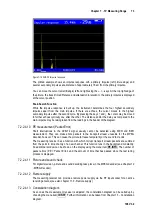
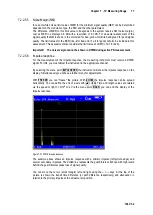
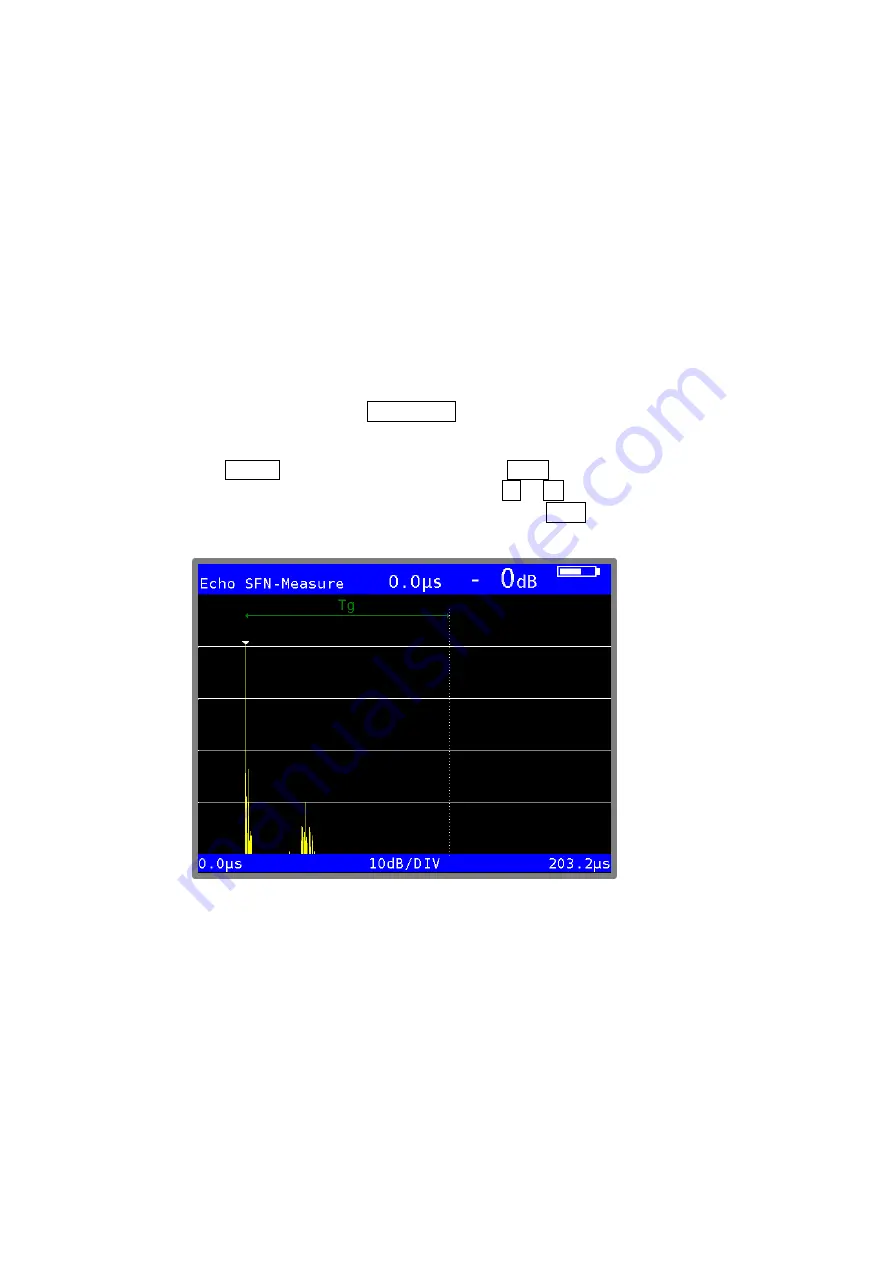
Figure 7-23 DTMB Impulse response
The example above shows an impulse response with a primary impulse (left picture edge) and
several secondary impulses. The dotted line represents the guard interval. Echoes with high levels
behind the guard interval cause loss of signal quality.
You can move the cursor (small triangle) left and right using the
←/→
keys. At the top of the
picture is shown the transit time difference (or path difference respectively) and attenuation in
relation to the primary impulse at the actual cursor position.

